Fig. 1
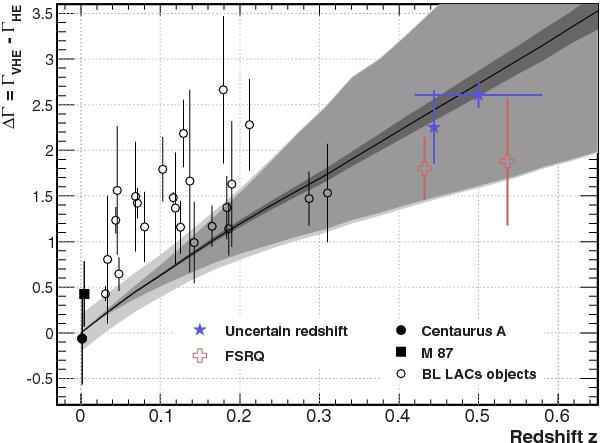
Value of ΔΓ as a function of the redshift z. The black line is the theoretical break obtained with the Franceschini et al. (2008) model. The uncertainties due to the energy resolution of IACTs (dark gray), the different threshold energies (medium gray), and the systematic errors of 0.2 (light gray) are shown. The FSRQs and the BL Lacs with uncertain redshift are shown for illustration.
Current usage metrics show cumulative count of Article Views (full-text article views including HTML views, PDF and ePub downloads, according to the available data) and Abstracts Views on Vision4Press platform.
Data correspond to usage on the plateform after 2015. The current usage metrics is available 48-96 hours after online publication and is updated daily on week days.
Initial download of the metrics may take a while.