Fig. 8
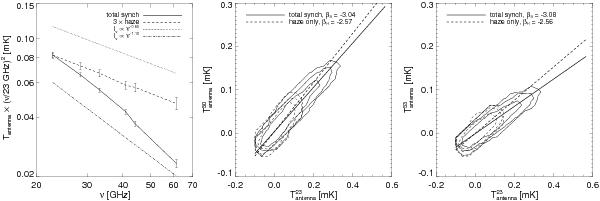
Left: spectrum measured from the residual in Fig. 6 in the region | l | < 35°, − 35° < b < − 10°. The haze spectrum is very nearly a power law with spectral index βH = − 2.56, while the total synchrotron emission in the region has a spectral index of βS = − 3.1 (see Sect. 4.3), significantly softer than the haze emission. This spectrum should be free from biases caused by template uncertainties. Middle and right: scatter plots (shown in contours) for both the haze (dotted) and total synchrotron (solid) emission using WMAP 23–33 GHz and Planck 30 GHz.
Current usage metrics show cumulative count of Article Views (full-text article views including HTML views, PDF and ePub downloads, according to the available data) and Abstracts Views on Vision4Press platform.
Data correspond to usage on the plateform after 2015. The current usage metrics is available 48-96 hours after online publication and is updated daily on week days.
Initial download of the metrics may take a while.