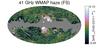
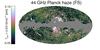
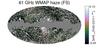
Fig. 5
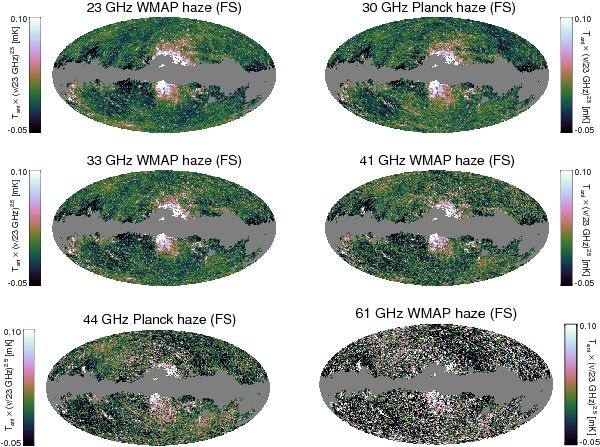
Microwave haze at WMAP and Planck frequencies using a full-sky template fit to the data. The morphology of the haze is remarkably consistent from band to band and between data sets, implying that the spectrum of the haze does not vary significantly with position. Furthermore, the ν2.5 scaling again yields about equal-brightness residuals, indicating that the haze spectrum is roughly Tν ∝ ν-2.5 through both the Planck and WMAP channels. In addition, while striping is negligible at low frequencies, above ~40 GHz it becomes comparable with, or brighter than, the haze emission (see text).
Current usage metrics show cumulative count of Article Views (full-text article views including HTML views, PDF and ePub downloads, according to the available data) and Abstracts Views on Vision4Press platform.
Data correspond to usage on the plateform after 2015. The current usage metrics is available 48-96 hours after online publication and is updated daily on week days.
Initial download of the metrics may take a while.