Fig. 10
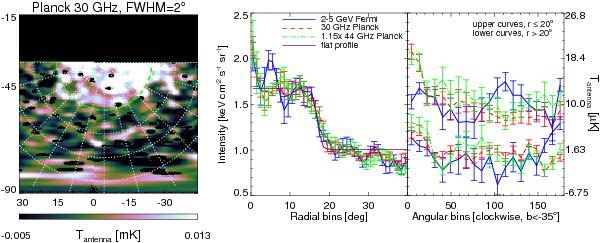
Left: a high southern latitude (b < −35°) view of the Galactic haze at Planck 30 GHz smoothed to 2°. There is a clear spatial correspondence between the haze and the Fermi bubbles shown in Dobler et al. (2010) and Su et al. (2010) including an edge at high latitudes (the green line arc roughly represents the southern Fermi bubble edge). Plotting the brightness in both the Fermi bubble and Planck haze as a function of the distance from the bubble center (taken to be (ℓ,b)cen = (−4.5°, −35.0°)) by integrating over angular bins as shown by the dotted lines reveals an unambiguous detection of an edge in the Planck haze (middle panel red and green lines) that is spatially coincident with the bubble edge in the Fermi data (middle panel blue line). This emission is consistent with an almost flat profile (purple line) at r ~ 17° from the bubble center. In addition, by integrating over radial bins and plotting as a function of angular bin for two ranges of r (right panel), there is a clear excess of emission inside compared to outside of the bubble in both the Planck and Fermi data.
Current usage metrics show cumulative count of Article Views (full-text article views including HTML views, PDF and ePub downloads, according to the available data) and Abstracts Views on Vision4Press platform.
Data correspond to usage on the plateform after 2015. The current usage metrics is available 48-96 hours after online publication and is updated daily on week days.
Initial download of the metrics may take a while.