| Issue |
A&A
Volume 554, June 2013
|
|
|---|---|---|
| Article Number | A2 | |
| Number of page(s) | 17 | |
| Section | Stellar structure and evolution | |
| DOI | https://doi.org/10.1051/0004-6361/201220252 | |
| Published online | 28 May 2013 | |
Chemical analysis of giant stars in the young open cluster NGC 3114⋆,⋆⋆
1 Observatório Nacional, Rua José Cristino 77, CEP 20921-400 São Cristóvão Rio de Janeiro, RJ, Brazil
e-mail: osantrich@on.br; claudio@on.br; drake@on.br
2 Sobolev Astronomical Institute, St. Petersburg State University, Universitetski pr. 28, 198504 St. Petersburg, Russia
Received: 18 August 2012
Accepted: 9 March 2013
Context. Open clusters are very useful targets for examining possible trends in galactocentric distance and age, especially when young and old open clusters are compared.
Aims. We carried out a detailed spectroscopic analysis to derive the chemical composition of seven red giants in the young open cluster NGC 3114. Abundances of C, N, O, Li, Na, Mg, Al, Ca, Si, Ti, Ni, Cr, Y, Zr, La, Ce, and Nd were obtained, as well as the carbon isotopic ratio.
Methods. The atmospheric parameters of the studied stars and their chemical abundances were determined using high-resolution optical spectroscopy. We employed the local-thermodynamic-equilibrium model atmospheres of Kurucz and the spectral analysis code MOOG. The abundances of the light elements were derived using the spectral synthesis technique.
Results. We found that NGC 3114 has a mean metallicity of [Fe/H] = −0.01 ± 0.03. The isochrone fit yielded a turn-off mass of 4.2 M⊙. The [N/C] ratio is in good agreement with the models predicted by first dredge-up. We found that two stars, HD 87479 and HD 304864, have high rotational velocities of 15.0 km s-1 and 11.0 km s-1; HD 87526 is a halo star and is not a member of NGC 3114.
Conclusions. The carbon and nitrogen abundance in NGC 3114 agree with the field and cluster giants. The oxygen abundance in NGC 3114 is lower compared to the field giants. The [O/Fe] ratio is similar to the giants in young clusters. We detected sodium enrichment in the analyzed cluster giants. As far as the other elements are concerned, their [X/Fe] ratios follow the same trend seen in giants with the same metallicity.
Key words: stars: abundances / open clusters and associations: general / open clusters and associations: individual: NGC 3114 / stars: evolution
Based on observations made with the 2.2 m telescope at the European Southern Observatory (La Silla, Chile).
Tables 2 and 5 are available in electronic form at http://www.aanda.org
© ESO, 2013
1. Introduction
Open clusters are very useful targets for probing the chemical evolution of the Galaxy in addition to H ii regions, planetary nebulae, cepheid variables, and OB stars. The chemical abundances of the open clusters at several galactocentric distances help us to investigate whether an abundance gradient in the galactic disk exists and so better understand the structure and evolution of the Milky Way. The advantage of open clusters is that they have a wide range of age and distance, in other words, they have formed at several epochs and at different galactocentric distances. Because of the range in age, from approximately 0.1 up to 12.0 Gyr, we can investigate whether there are any noticeable difference in the abundance ratios [X/Fe] due to evolutionary effects when young and old clusters are compared. Because young clusters are composed of more massive stars than old clusters, a comparison of giants of different clusters would show differences in abundances (if any) due to some nuclear process that might have occurred in these more massive stars. In addition, we could also compare how processes such as the first dredge-up and extra-mixing affect the chemical composition of these higher mass giant stars.
Log of the observations and relevant information for the target stars.
In this work we will analyze seven giants in the young open cluster NGC 3114 using high-resolution spectroscopy with the aim of obtaining their abundance pattern. Some previous photometric studies have been done for NGC 3114 (Jankowitz & McCosh 1963; Schneider & Weiss 1988; Clariá et al. 1989; Sagar & Sharpless 1991; Carraro & Patat 2001; Paunzen et al. 2003), but a high-resolution spectroscopic analysis of the giants in this cluster has not been done yet. As we shall see, the giants in NGC 3114, like many other giants in young clusters, have a lower oxygen abundance compared to the giants in old clusters. We also detected a sodium enrichment in the atmospheres of the giants in this cluster. Here we have considered as young clusters those with ages less than 1.0 Gyr, and as old those with ages higher than 1.0 Gyr. The abundances of other elements, the lighter ones (carbon, nitrogen, and lithium) and the heavier (aluminum to neodymium), as well as the carbon isotopic ratio were also obtained.
The open cluster NGC 3114 (C 1001-598, VDBH 86; α = 10h02 0, δ = − 60°06′(2000.0); l = 283°, b = − 04°) is projected onto the Carina complex (Carraro & Patat 2001). These authors presented a CCD photometric study of NGC 3114 and obtained UBVRI magnitudes down to V ≈ 22.0. Their results for the age, the distance, and color excess are 1.6 × 10⁸ years, 920 ± 50 pc, and E(B − V) = 0.07. Similar values were also found by González & Lapasset (2001). Because NGC 3114 lies in a region of heavy contamination by field stars, it is difficult to distinguish between members and non-members of NGC 3114. Thanks to the radial-velocity survey of González & Lapasset (2001) and more recently of Mermilliod et al. (2008), several stars were identified as members of this cluster, including the seven red giants analyzed in this work. The CMD of NGC 3114 is shown in Fig. 1, with our sample stars (red squares) for identification. From the isochrone fit, we derived a turn-off mass of 4.2 M⊙. The age and turn-off mass of NGC 3114 are similar to the young cluster M 11 studied by Gonzalez & Wallerstein (2000).
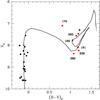 |
Fig. 1 Reddening corrected color–magnitude diagram of NGC 3114. Black filled circles are kinematically main-sequence member stars from Tables 2 and 3 of González & Lapasset (2001). Our program stars are identified by red filled squares. We also show the isochrone of Bertelli et al. (1994) for log t = 8.2 (0.16 Gyr), Z = 0.02, and Y = 0.28. |
2. Observations
The high-resolution spectra of the stars analyzed in this work were obtained at the 2.2 m ESO telescope at La Silla (Chile) with the FEROS (Fiberfed Extended Range Optical Spectrograph) echelle spectrograph (Kaufer et al. 1999). The FEROS spectral resolving power is R = 48 000, corresponding to 2.2 pixels of 15 μm, and the wavelength coverage is from 3800 Å to 9200 Å. The stars were selected from the radial velocity survey of Mermilliod et al. (2008). Table 1 gives the log of observations and additional information about the observed stars. The nominal S/N ratio was evaluated by measuring the rms flux fluctuation in selected continuum windows, and the typical values were S/N = 100–150.
3. Analysis and results
3.1. Line selection, measurement and oscillator strengths
The spectra of the stars show many atomic absorption lines of Fe i and Fe ii as well as transitions due to Na i, Mg i, Al i, Si i, Ca i, Ti i, Cr i, Ni i, Y ii, Zr i, La ii, Ce ii, and Nd ii. We have chosen a set of lines sufficiently unblended to yield reliable abundances. In Table 2 we list the Fe i and Fe ii lines employed in the analysis, the lower excitation potential of the transitions, χ (ev), the gf-values, and the measured equivalent widths. The equivalent widths were obtained by fitting Gaussian profiles to the observed ones. The gf-values for the Fe i and Fe ii lines in Table 2 were taken from Lambert et al. (1996) and Castro et al. (1997).
To avoid systematic errors in the abundance analysis we determined the solar abundance using the same program and line lists. We used the solar spectrum of Ganimede taken with the ESO spectrograph HARPS. We used the solar atmosphere model of Kurucz (1993) Teff = 5777, log g = 4.44 and the microturbelent velocity of ξ = 0.75 km s-1 (Pavlenko et al. 2012). The results of our analysis are given in Table 3 and are in good agreement with those given by Grevesse & Sauval (1998, hereafter GS98) which are also shown in Table 3. We derived a low aluminum abundance and adopted the abundance of GS98. A low solar aluminum abundance was also found by Reddy et al. (2012). According to Pancino et al. (2010) the lines of aluminum at 6696 Å and 6698 Å give lower abundances than other aluminum lines. Carbon, nitrogen, and oxygen abundances were determined using the spectrum synthesis technique. The abundances of carbon and nitrogen were determined using the lines of the CN and C2 molecules. We assembled the line lists and they are the same as in Drake & Pereira (2008, 2011) and Pereira & Drake (2009) who studied the chemically peculiar metal-poor stars HD 104340, HD 206983, HD 10613, BD+04°2466, and the Feh-Duf star. For the determination of the oxygen abundance we used the [O i] forbidden line at 6300.304 Å. The derived [X/H] and [X/Fe] ratios in this work were calculated using the solar abudances given in Table 3.
3.2. Atmospheric parameters
The determination of stellar atmospheric parameters such as effective temperature (Teff), surface gravity (log g), microturbulence (ξ), and metallicity, as given by [Fe/H] (throughout we use the notation [X/H] = log (NX/NH)⋆ − log (NX/NH)⊙) are prerequisites for the determination of photospheric abundances. The atmospheric parameters were determined using the local thermodynamic equilibrium (hereafter LTE) model atmospheres of Kurucz (1993) and the spectral analysis code MOOG (Sneden 1973).
The solution of the excitation equilibrium used to derive the effective temperature (Teff) was defined by a zero slope of the trend between the iron abundance derived from Fe i lines and the excitation potential of the measured lines. The microturbulent velocity (ξ) was found by constraining the abundance, determined from individual Fe i lines, to show no dependence on Wλ/λ. The solution thus found is unique, depending only on the set of Fe i and Fe ii lines and the atmospheric model employed. As a by-product this yields the metallicity [Fe/H] of the star. The value of log g was determined by means of the ionization balance assuming LTE. The final adopted atmospheric parameters are given in Table 4.
Adopted atmospheric parameters and metallicity.
Previous determination of atmospheric parameters in one of the stars in this cluster, HD 87566 (number 181), was done by Santos et al. (2009) who found two different solutions according to the line lists used: (i) Teff = 4561 ± 45 K, log g = 1.92 ± 0.32 dex, ξ = 2.02 ± 0.04 km s-1, and [Fe/H] = −0.11 ± 0.13 dex, and (ii) Teff = 4384 ± 147 K, log g = 1.65 ± 0.36 dex, ξ = 2.01 ± 0.15 km s-1, and [Fe/H] = −0.23 ± 0.17 dex.
The internal errors in our adopted effective temperatures (Teff) and microturbulent velocities (ξ) can be determined from the uncertainty in the slopes of the relationships of Fe i abundance versus excitation potential and Fe i abundance versus reduced equivalent width (Wλ/λ). The standard deviation in log g was set by changing this parameter around the adopted solution until the difference between Fe i and Fe ii mean abundance differed by exactly one standard deviation of the [Fe i/H] mean value. Based on the above description, we estimate typical uncertainties in atmospheric parameters of the order of ± 140 K, ± 0.20–0.25 dex, and ± 0.3 km s-1, respectively, for Teff, log g, and ξ.
We compare the derived spectroscopic gravities for each star of the cluster with those obtained from the equation 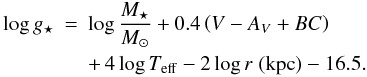 (1)For the mass we adopted the turn-off mass of the cluster and for the distance and color excess we adopted r = 920 pc and E(B − V) = 0.07. Bolometric corrections were taken from Alonso et al. (1999). We found a mean difference of 0.27 ± 0.2 between the spectroscopic and evolutionary gravities as given from the above equation. This mean difference lies in the same range of the uncertainties introduced by the standard deviation in log g.
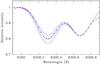 |
Fig. 2 Observed (dotted red line) and synthetic (solid blue line) spectra of HD 87109 in the region around the oxygen forbidden line at λ6300 Å. The synthetic spectra were calcultaed with the oxygen abundances of [O/Fe] = −0.30, − 0.20, and − 0.10. |
3.3. Abundance analysis
The abundances of chemical elements were determined with the LTE model atmosphere techniques. In brief, equivalent widths are calculated by integration through a model atmosphere and by comparing this with the observed equivalent widths. The calculations are repeated, changing the abundance of the element in question, until a match is achieved. The current version of the line-synthesis code MOOG (Sneden 1973) was used to carry out the calculations. Table 5 shows the atomic lines used to derive the abundances of the elements. Atomic parameters for several transitions of Ti, Cr, and Ni were retrieved from the National Institute of Science and Technology Atomic Spectra Database (Martin 2002).
Light element abundances.
The carbon, nitrogen, and oxygen abundances were derived as described in Sect. 3.1. The abundances of the CNO elements are interdependent because of the association of carbon and oxygen in CO molecules in the atmospheres of cool giants, therefore the CNO abundance determination procedure was iterated until all the abundances of these three elements agreed. The 12C/13C isotopic ratios were determined using the lines of the CN molecules. In Figs. 2 and 3 we show the observed and synthetic spectra in the regions of the [O i] λ6300 Å line and ~λ8000 Å containing the 12CN and the 13CN molecular lines.
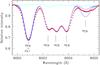 |
Fig. 3 Observed (dotted red line) and synthetic (solid blue line) spectra of the star HD 87109 in the region containing the 12CN and the 13CN molecular lines. In the synthetic spectra we show the synthesis for three values of 12C/13C ratios, 12.0, 21.0, and 36.0. The light blue solid line shows the spectrum of the hot star used to map the telluric water lines. |
Lithium abundance was derived from the synthetic spectra matches to the Li i λ6708 Å resonance doublet. The CN lines in the vicinity of the Li i doublet were included in the line list. The wavelengths and oscillator strengths for the individual hyperfine and isotopic components of the lithium lines were taken from Smith et al. (1998) and Hobbs et al. (1999). A solar 6Li/7Li isotopic ratio (6Li/7Li = 0.081) was adopted in the calculations of the synthetic spectrum.
Table 6 shows the abundance of light elements (lithium, carbon, nitrogen, and oxygen). Except for lithium, we show the abundances for each star in the notation [X/Fe]. In Table 6 we also provide the 12C/13C isotopic ratio and show the mean cluster abundances and their standard deviations, i.e., the scatter around the mean. For the calculation of the mean abundance of the cluster we do not take into account the results for HD 87526 which is a non-member of the cluster (Sect. 4.2). Tables 7 and 8 provide, for each star, the derived mean abundances of the elements in the notation [X/Fe] and the mean cluster abundances with their respective standard deviations. Furthermore, we obtained the abundances of the heavy elements created by slow neutron capture reactions (s-process): Y, Zr, La, Ce, and Nd. The mean abundances of these heavy elements, s in the notation [s/Fe], are included in Table 8. We do not measure the barium abundance in our stars because all barium lines have equivalent widths higher than 200 mÅ and therefore they will not lie at the linear part of the curve of growth (Hill et al. 1995). However, since we have measured several lines of other elements synthesized by the s-process, we think that we probe this nucleosynthesis process in our cluster giants fairly well.
Mean abundance ratios ([X/Fe]) for the elements from Na to Cr.
Mean abundance ratios ([X/Fe]) for Ni and the heavy elements.
3.4. Abundance uncertainties
The uncertainties in the derived abundances for the program stars are dominated by three main sources: the stellar parameters, the measured equivalent widths, and the gf-values. The errors in the gf-values were discussed by Smith et al. (1995) and we thus refer to this paper for a detailed discussion.
The abundance uncertainties due to the errors in the stellar atmospheric parameters Teff, log g, and ξ were estimated by changing these parameters by their standard errors and then computing the changes incurred in the element abundances. This technique has been applied to the abundances determined from equivalent line widths as well as to those determined via spectrum synthesis. The results of these calculations for HD 87109 are displayed in Cols. 2 to 6 of Table 9. The abundance variations for the other stars show similar values.
The abundance uncertainties due to the errors in the equivalent width measurements were computed from the expression provided by Cayrel (1988). The errors in the equivalent widths are set, essentially, by the signal-to-noise ratio and the resolution of the spectra. In our case, having a resolution of 48 000 and a typical S/N ratio of 150, the expected uncertainties in the equivalent widths are about 2–3 mÅ. For all measured equivalent widths, these uncertainties lead to lower errors in the abundances than those coming from the uncertainties in the stellar parameters.
Under the assumption that the errors are independent, they can be combined quadratically so that the total uncertainty is given by  These final uncertainties are given in the Col. 7 of Table 9. The last column gives the abundance dispersion observed among the lines for those elements with more than three available lines.
Table 9 shows that neutral elements are more sensitive to the variations in the temperature while singly-ionized elements are more sensitive to the variations in log g. For the elements whose abundance is based on stronger lines, such as the lines of calcium and yttrium, the error introduced by the microturbulence is significant.
Abundance uncertainties for HD 87109.
We also estimated the influence of model errors, such as uncertainties in the effective temperatures and surface gravities, on the derived CNO abundances. Uncertainties in the carbon abundances result in variation of nitrogen abundances, since the CN molecular lines were used for the N abundance determination. The variations of the abundance due to changes in effective temperature ( + 140 K), surface gravity ( + 0.4 dex), and CNO abundances are summarized in Table 10 for HD 87109. In the last column we present the resulting abundance uncertainties σtot calculated as the square root of the squares of the various sources of uncertainty. Derived CNO abundances are weakly sensitive to the variations of the microturbulent velocity since weak lines were used for their determination. Calculations of the carbon isotopic ratios do not depend on the uncertainties in the C and N abundances and molecular parameters. The errors in the 12C/13C determinations are mainly due to uncertainties in the observed spectra, such as possible contamination by unidentified atomic or molecular lines, or uncertainties in the continuum placement.
Effect of errors in atmospheric parameters and carbon, oxygen, and nitrogen abundances on the CNO abundances.
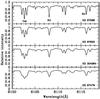 |
Fig. 4 Normalized spectra of HD 87566, HD 87833, HD 304864, and HD 87479 with some identified absorption lines. HD 87566 has a low rotational velocity vsini < 4.5 km s-1. In the spectra of HD 87833, HD 304864, and HD 87479 we see the absorption lines broadened by the rotation velocity of 8.0 km s-1, 11 km s-1, and 15 km s-1. |
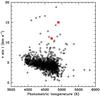 |
Fig. 5 Projected rotational velocities for giant stars as a function of photometric temperature. The open squares represent the stars from the sample studied by Carlberg et al. (2011) and the red squares the stars HD 87479 and HD 304864. |
4. Discussion
4.1. The rotational velocity
As was presented in Table 1, four giant stars of NGC 3114 (HD 87109, HD 87479, HD 87833, and HD 304864) have rotational velocities higher than 2 km s-1, which is a typical value found among the cool giant stars (Carlberg et al. 2011). Of about 1300 stars investigated by these authors, 30% have rotational velocities between 5 and 10 km s-1 and only 2% of the sample (24 stars) have rotational velocities higher than 10 km s-1. In Fig. 4 we show the spectra of HD 87566, HD 87833, HD 304864, and HD 87479 where we can see the effects of the rotation on the broadening of stellar absorption lines compared to the low rotating giant HD 87566. Figure 5 shows the positions of HD 87479 and HD 304864 in the vsini versus photometric temperature diagram of Carlberg et al. (2011). Therefore, the discovery of HD 87479 as a rapid rotating giant star raises interesting questions. One possibility is that HD 87479 is in reality a binary system and is forced to co-rotate with its companion, and so described as a tidally locked binary. In this case, HD 87479 would be a double-lined SB2 spectroscopic binary. However, our data show that it has a single-line spectrum. If HD 87479 is a single star, its rapid rotation could be explained as a consequence of dregde-up of angular momentum from a fast rotating core or of the accretion of a planet (Carlberg et al. 2011).
In open clusters rapid rotating giants are very rare. In M 67, Melo et al. (2001) showed that the fast rotators are turn-off stars, and that the rotational velocity declines along the subgiant and red giant branches. Other studies found a similar behavior for dwarfs and giants in open clusters (Pace et al. 2010). However, in the open cluster Berkeley 21, one giant (T 406) is a fast rotator and also a lithium-rich star Yong et al. (2005). This giant rotates with a speed similar to that of HD 87479. Planet accretion is the most likely explanation to account for the lithium enrichment and the rapid rotation for this star. It is interesting to note that another giant star in this cluster, T 33, analyzed by Hill & Pasquini (1999), is also a lithium-rich star but is not a fast rotator. The stars HD 87479 and HD 304864 set another constraint for possible internal or external mechanisms in order to explain their high rotational velocities and no lithium enrichment.
4.2. The abundance pattern
4.2.1. Metallicity
The open cluster NGC 3114 has solar metallicity. Clariá et al. (1989) derived a mean photometric metallicity of [Fe/H] = − 0.04 and Twarog et al. (1997) derived a photometric metallicity of [Fe/H] = +0.02. Excluding HD 87526, our mean cluster metallicity is − 0.01 ± 0.03 which is in agreement with these previous studies.
As shown in Table 4, HD 87526 is a metal-poor star, suggesting that this star does not belong to the cluster. In fact, Frye et al. (1970) using UBV photometry concluded that HD 87526 is a foreground star. The results for the abundance ratios of the α-elements given in Table 7 provides further evidence that HD 87526 may belong to the thick disk/halo. The [α/Fe] ratio is 0.21 ± 0.27 as given by mean abudance of the elements Mg, Si, Ca, and Ti which is a typical value for the stars in this metallicity range (Carretta et al. 2002). Its abundance pattern is also discussed together with the cluster giants. In the following sections we discuss the abundance pattern of the stars analyzed in this work.
4.2.2. Carbon, nitrogen, and oxygen
The cluster giants analyzed in this work display [C/Fe] and [N/Fe] ratios similar to the giants of the same metallicity studied by Mishenina et al. (2006) and Luck & Heiter (2007). The [C/Fe], [N/Fe], and [O/Fe] ratios, from the two papers mentioned above, were computed using absolute abundances obtained in these papers and then converted to [X/Fe] ratios using the solar abundances adopted in this work (Sect. 3.3). As shown in Fig. 6, our [C/Fe] and [N/Fe] ratios for the cluster giants of NGC 3114 have similar values to the giants analyzed by Mishenina et al. (2006) and Luck & Heiter (2007).
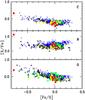 |
Fig. 6 Abundance ratios [X/Fe] versus [Fe/H]. Red squares: cluster giants of NGC 3114; blue crosses: field giants of Luck & Heiter (2007); black crosses: clump giants of Mishenina et al. (2006); yellow crosses: clump giants of Tautvaišienė et al. (2010); green filled squares: mean abundances of other open clusters (with ages higher than 1.0 Gyr); green open squares: clusters with ages less than 1.0 Gyr. Data from young clusters were taken from Smiljanic et al. (2009; IC 4756, NGC 3532, NGC 2447, NGC 2360, NGC 6281, NGC 6633); Pancino et al. (2010; NGC 2099); Jacobson et al. (2011; NGC 1245 and NGC 1817); Carrera & Pancino (2011; Hyades and Praesepe); Začs et al. (2011; NGC 1545 and Tr 2); Villanova et al. (2009; NGC 6475); Brown et al. (1996; Mellote 71). Data from old clusters were taken from Pacino et al. (2010; NGC 2420, NGC 7789, Cr 100, M 67); Carrera & Pancino (2011; Berkeley 32 and NGC 752); Jacobson et al. (2011; NGC 2158); Jacobson et al. (2008; NGC 7142); Friel et al. (2010; NGC 188 and Berkeley 39); Carretta et al. (2005; Cr 261); Gratton & Contarini (1994; Mellote 66 and NGC 2243); Friel et al. (2005; Berkeley 17); Young et al. (2005; Berkeley 20 and Berkeley 29). |
In dwarf stars there is no trend for the [N/Fe] ratio versus [Fe/H] in the metallicity range − 2.0 < [Fe/H] < + 0.3, in other words, the [N/Fe] ratio is ≈ 0.0 (Clegg et al. 1981; Tomkin & Lambert 1984; Carbon et al. 1987). However, as a star becomes giant, because of the deepening of its convective envelope, nuclear processed material is brought from the interior to the outer layers of the star changing the surface composition. As a consequence of the first dredge-up process, the abundance of 12C is reduced and the abundance of 14N is enhanced (Lambert 1981). Our results for the [C/Fe] and [N/Fe] show the effects of the first dredge-up; carbon is underabundant (all giants in NGC 3114 have [C/Fe] < 0.0) while nitrogen is overabundant.
Carbon abundance in HD 87526 follows the corresponding value for the stars of the same metallicity in the Galaxy (Fig. 6). HD 87526 has a high [N/Fe] ratio of +1.15 and HD 167768, analyzed by Luck & Heiter (2007), also displays a high [N/Fe] ratio of +0.91, at a metallicity of [Fe/H] = − 0.61, similar to the metallicity of HD 87526.
Figure 6 also shows the abundances of carbon and nitrogen of the giants of NGC 3114 compared with other cluster giants. There are not many available CN abundance determinations for red giants of open clusters, yet we found some results from the analysis of NGC 6067 and IC 4725 (Luck 1994), IC 4651 (Mikolaitis et al. 2011a,b), NGC 7789 (Tautvaišienė et al. 2005) and IC 4756, NGC 2360, NGC 2447, NGC 3532, NGC 5822, NGC 6134, NGC 6281, and NGC 6633 (Smiljanic et al. 2009). The [N/C] ratio has been used as a diagnostic of the first dredge-up in cluster giants (Smiljanic et al. 2009) and also for comparison with the evolutionary models of Schaller et al. (1992). We found a mean value of 0.64 ± 0.11 for the cluster giants of NGC 3114 which is in a good agreement with the value 0.6 predicted by Schaller et al. (1992) for a star of mass 4 M⊙. For the ratio [N/C] we did not find any noticeable difference between the giants in NGC 3114 and the giants of other clusters. Figure 6 shows the oxygen abundance in our cluster giants compared with the giants of the same metallicity analyzed by Mishenina et al. (2006) and Luck & Heiter (2007). We see that the giants of NGC 3114 have lower [O/Fe] ratios than the giants of these two samples. This figure also shows other [O/Fe] determinations for old and young clusters.
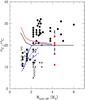 |
Fig. 7 The 12C/13C ratio in giants of open clusters versus the turn-off mass. Data points represent the isotopic ratio for each star of the cluster. Filled circles are data from Gilroy (1989), open squares data from Smiljanic et al. (2009), and crosses data from Mikolaitis et al. (2011a,b, 2012). Red squares represent the stars of NGC 3114. The theoretical 12C/13C ratio as a function of stellar mass is taken from the models of Schaller et al. (1992), black solid line. Other models from Charbonnel & Lagarde (2010) are also shown: standard, red solid line; thermohaline mixing, blue solid line; thermohaline and rotation-induced mixing with 110 km s-1, blue short-dashed line; thermohaline and rotation-induced mixing with 250 km s-1, blue long-dashed line. |
4.2.3. 12C/13C ratio
The carbon isotopic ratio has already been investigated in some open clusters, nonetheless there are few papers dedicated to obtaining this ratio. Previous carbon isotopic ratio determinations in open clusters were done by Gilroy (1989), Luck (1994), Tautvaišienė et al. (2000), Smiljanic et al. (2009), and Mikolaitis et al. (2010, 2011a,b). Figure 7 shows the carbon isotopic ratio for stars of NGC 3114 analyzed in this paper and of other clusters as a function of the cluster turn-off mass. In this figure, we also show the expected carbon isotopic ratio from the standard first dredge-up models of Schaller et al. (1992). Gilroy (1989) was the first to show that there is a change in the carbon isotopic ratio for clusters with turn-off mass less than 2.2 M⊙. Smiljanic et al. (2009) were able to show that some cluster giants with turn-off masses higher than 2.0 M⊙ could also have low carbon isotopic ratios as the low-mass stars. These low ratios seen in more massive stars are currently attributed to non-canonical mixing or thermohaline convection (Stancliffe et al. 2007).
We inspected whether there would be any connection between the position of a giant in the color-magnitude diagram (Fig. 1) and 12C/13C and [N/C] ratios. The stars 6 (=HD 87109), 150 (=HD 87479), and 283 (=HD 304864) are probably post-helium flash giants, and the stars 181 (=HD 87566), 238 (=HD 304859), and 262 (=HD 87833) seem to be first-ascent giants. We did not detect any significant variations in the carbon isotopic ratio among these classes of giants. As far as the [N/Fe] ratio is concerned, only the star 238 (=HD 304859) has a relatively low ratio.
The open cluster analyzed in this work adds more data points at one turn-off mass in Fig. 7 so that a determination of the 12C/13C ratio in more cluster giants would be very important for understanding the physics of the dredge-up and mixing phenomena.
4.2.4. Li
In their thorough study of the Li abundance in G-K giants, Brown et al. (1989) showed that field giants have a mean lithium abundance of log ε(Li) ≈ + 0.1. In giants of open clusters, lithium abundances have already been investigated by Gilroy (1989), Luck (1994), Pasquini et al. (2001) for NGC 3680, Pasquini et al. (2004) for IC 4651, Gonzalez & Wallerstein (2000) for M 11 and Začs et al. (2011) for NGC 1545 and Tr 2. The main result of these investigations showed that lithium abundance in evolved K giants is very low ( − 1.0 < log ε(Li) < 1.0), lower than predicted by the standard evolution models of Iben (1966, 1967). An extramixing mechanism is the most likely explanation of the low lithium abundances observed in cluster giants (Pasquini et al. 2001; Gilroy 1989).
The mean value of lithium abundance for the giants of NGC 3114 is log ε(Li) = 0.9 ± 0.4 and is slighty above the value for cluster giants with a turn-off mass of 4.0 M⊙ analyzed by Gilroy (1989). Lithium abundance was derived for the young open cluster M 11 by Gonzalez & Wallerstein (2000). For this cluster having the same turn-off mass 4 M⊙ as NGC 3114, they found a mean lithium abundance of 1.2 ± 0.3.
4.2.5. Other elements: Na to Ni
Sodium overabundance has been observed in the atmospheres of A–F supergiant stars (Denisenkov & Ivanov 1987). According to these authors, sodium is synthesized in the convective core of main-sequence stars in the NeNa cycle. Mixing at the first dredge-up carries products of the CNO cycle to the surface of stars. Therefore, one should expect sodium enrichment in supergiants and giants but not in dwarfs. In fact, Fig. 2 of Boyarchuk et al. (2001) shows that [Na/Fe] is anti-correlated with log g. It is known that sodium lines suffer from NLTE effects which lead to an overestimation of the sodium abundances. To account for NLTE effects we used the theoretical work of Gratton et al. (1999) who calculated the values of the NLTE corrections for several sodium lines using a grid of different atmospheric parameters and equivalent widths of the sodium lines. For HD 87526, a non-member of the cluster, we found a correction of ≈ 0.3 dex for the lines 6154.22 Å and 6160.75 Å used for the sodium abundance determination considering the temperature and gravity of this star. Therefore, for HD 87526 we have [Na/Fe] = +0.36. For the giants of NGC 3114 with equivalent widths of the analyzed sodium lines around 120 mÅ, the NLTE corrections are less than 0.2 dex.
For aluminum, the ratio [Al/Fe] observed in our cluster giants has the same value as the field giants of the same metallicity. In HD 87526 this ratio is in agreement with the trend seen for the stars of similar metallicity.
As for the α-elements defined in Sect. 4.2.1, our cluster giants follow the same trend as seen in the local disk field giants studied by Luck & Heiter (2007) and disk red-clump giants studied by Mishenina et al. (2006).
Iron peak elements are formed in large amounts in Type Ia supernovae and all these elements should follow the same trend with iron abundance. Indeed, nickel does remain constant with [Ni/Fe] = 0.0 for − 0.8 < [Fe/H] < 0.1 (Luck & Heiter 2007). For the element chromium, the study for the local giants of Luck & Heiter (2007) found a tight correlation between [Fe/H] and [Cr/H] ratios with a correlation coefficient of 1.06, i.e., [Cr/Fe] ≃ 0.0 for − 0.8 < [Fe/H] < 0.2, despite some discrepant points as they reported. Our cluster giant ratios also follow the general trend seen for the field giants.
In HD 87526 the abundance ratios [X/Fe] of iron group elements (Cr and Ni) have similar values as dwarf stars of the same metallicity (Edvardsson et al. 1993).
4.2.6. Heavy elements: neutron-capture elements
In field giant stars, abundances of s-process elements were investigated by Mishenina et al. (2006, 2007) and Luck & Heiter (2007). In both of these studies the authors found that the abundance ratios [X/Fe] for Y, La, Ce, and Nd remain flat at 0.0 between − 0.7 < [Fe/H] < + 0.3. Figure 8 shows these ratios for individual neutron-capture elements as well as the mean values of these s-elements, in the notation [s/Fe].
The s-process element abundances observed in HD 87526 also follow the same trend as in giants and dwarfs of the same metallicity. For yttrium and neodymium we also used the results of Fulbright (2000) and Edvardsson et al. (1993) for the dwarf stars with metallicities between − 1.0 < [Fe/H] < − 0.5 for comparison with our results for HD 87526.
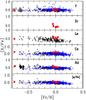 |
Fig. 8 Abundance ratios [X/Fe] versus [Fe/H]. Symbols have the same meaning as in Fig. 6. In addition we provide results for yttrium (open squares; Fulbright 2000) and neodymium (filled circles, Edvardsson et al. 1993) for dwarf stars to compare with the abundances of HD 87526. |
We also comment on the behavior of the heavy-element abundance pattern with age. The studies of heavy-element abundance pattern in cluster giants are scarce in the literature and are mostly based on one or two elements with only a few lines analyzed. Zirconium is one of these elements with abundances based on few lines (Maiorca et al. 2011, see also Friel et al. 2010). In our sample we were able to measure more than three lines of zirconium in the spectra of all stars except the metal-poor star HD 87526 and the high-rotating stars HD 87479 and HD 304864 (Table 1). Because of high rotation some weaker lines in the spectra of these stars become washed away in rotationally broadened profiles. For this reason we were able to measure only a few lines of zirconium in the spectrum of HD 304864 and none in the spectrum of HD 87479.
Recently, Maiorca et al. (2011) presented the results of their investigation on the abundance pattern of s-process elements based on a large sample of 19 open clusters. In this study, after analyzing a sample of dwarfs and giants in open clusters, they noticed that the youngest open clusters were the most s-process enriched. In Fig. 9 we show the mean abundance of s-process elements using the results presented in Maiorca et al. (2011) and the mean s-process abundance from Table 8 of this work. The open cluster NGC 3114 also follows the trend noticed by Maiorca et al. (2011).
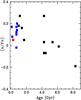 |
Fig. 9 Mean s-process abundances versus age for NGC 3114 compared with a sample of the open clusters analyzed by Maiorca et al. (2001). |
5. Conclusions
The main conclusions of our abundance analysis employing high-resolution optical spectra of the giants in NGC 3114 can be summarized as follows:
-
1.
NGC 3114 is a young cluster (0.16 Gyr) with a turn-off massof 4.2 M⊙. It has a solar metallicity of [Fe/H] = −0.01 ± 0.03 in agreement with previous photometric studies. There are a few clusters with turn-off mass determined, therefore the determination of the turn-off mass for NGC 3114 adds another point to this small sample.
-
2.
The star HD 87526 belongs to the thick disk/Galactic halo because the metallicity and the abundances are very different from the other giants of the cluster and is not a member of NGC 3114.
-
3.
Two stars have high rotational velocities higher than the other stars in the clusters. HD 87479 and HD 304864 have 15.0 km s-1 and 11.0 km s-1.
-
4.
Analysis of the light elements reveals that carbon has a low abundance and that nitrogen shows an enrichment, similar to field giant stars and giants of other clusters. The [N/C] ratio is in good agreement with the predictions given by the models of Schaller et al. (1992) after the first dredge-up. The carbon isotopic ratio (Fig. 5) lies slighty below the predicted value for a cluster with a turn-off mass of 4.0 M⊙. The derived value of 12C/13C ≥ 18 for NGC 3114 is similar to the value for M 11 (16–20), a cluster with the same age and turn-off mass (Gonzalez & Wallerstein 2000).
-
5.
The open cluster NGC 3114 follows the trend of heavy-element abundance seen in other open clusters (Maiorca et al. 2011), that is, an enrichment of s-process elements in young clusters compared to old clusters.
-
6.
Further spectroscopic analysis of other young clusters will be welcome in order to investigate the abundance pattern in intermediate mass stars as they evolve away from the main-sequence. On the other hand, some studies for dwarfs in young clusters (Ford et al. 2005; Stütz et al. 2006; Pace et al. 2010; Villanova et al. 2009) showed that oxygen has solar abundance and shows no depletion seen in giants of these clusters. This indicates that evolutionary aspects and mixing changed the abundance of clusters giants. Further abundance analysis of dwarfs and (a few) subgiant stars in these clusters will also be welcome.
Online material
Observed Fe i and Fe ii lines.
Other lines studied.
Acknowledgments
N.A.D. acknowledges the support of the PCI/MCTI (Brazil) grant under the Project 311.868/2011-8. This research has made use of the SIMBAD database, operated at CDS, Strasbourg, France.
References
- Alonso, A., Arribas, S., & Martŋnez-Roger, C. 1999, A&AS, 140, 261 [NASA ADS] [CrossRef] [EDP Sciences] [Google Scholar]
- Antipova, L. I., Boyarchuk, A. A., Pakhomov, Yu. V., & Yushkin, M. V. 2005, ARep, 49, 535 [NASA ADS] [Google Scholar]
- Bertelli, G., Bressan, A., Chiosi, C., Fagotto, F., & Nasi, E. 1994, A&AS, 106, 275 [NASA ADS] [Google Scholar]
- Blackwell, D. E., Booth, A. J., Menon, S. L. R., & Petford, A. D. 1986, MNRAS, 220, 289 [NASA ADS] [CrossRef] [Google Scholar]
- Boyarchuk, A. A., Antipova, L. I., Boyarchuk, M. E., & Savanov, I. S. 2001, Astron. Rep., 45, 301 [NASA ADS] [CrossRef] [Google Scholar]
- Brown, J. A., Sneden, C., Lambert, D. L., & Dutchover, E. Jr. 1989, ApJS, 71, 293 [NASA ADS] [CrossRef] [Google Scholar]
- Brown, J. A., Wallerstein, G., Geisler, D., & Oke, J. B. 1996, AJ, 112, 1551 [NASA ADS] [CrossRef] [Google Scholar]
- Carbon, D. F., Barbuy, B., Kraft, R. P., Friel, E. D., & Suntzeff, N. B. 1987, PASP, 99, 335 [NASA ADS] [CrossRef] [Google Scholar]
- Carlberg, J. K., Majewski, S. R., Patterson, R. J., et al. 2011, ApJ, 732, 39 [Google Scholar]
- Carraro, G., & Patat, F. 2001, A&A, 379, 136 [NASA ADS] [CrossRef] [EDP Sciences] [Google Scholar]
- Carrera, R., & Pancino, E. 2011, A&A, 535, A30 [NASA ADS] [CrossRef] [EDP Sciences] [Google Scholar]
- Carretta, E., Gratton, R., Cohen, J. G., Beers, T. C., & Christlieb, N. 2002, AJ, 124, 481 [NASA ADS] [CrossRef] [Google Scholar]
- Carretta, E., Bragaglia, A., & Gratton, R. G. 2007, A&A, 473, 129 [NASA ADS] [CrossRef] [EDP Sciences] [Google Scholar]
- Castro, S., Rich, R. M., Grenon, M., Barbuy, B., & McCarthy, J. K. 1997, AJ, 114, 376 [NASA ADS] [CrossRef] [Google Scholar]
- Cayrel, R., 1988, Data Analysis, in The Impact of Very High S/N Spectroscopy on Stellar Physics Kluwer, Dordrecht, eds. G. Cayrel de Strobel, & M. Spite, 345 [Google Scholar]
- Charbonnel, C., & Lagarde, N., 2010, A&A, 522, A10 [CrossRef] [EDP Sciences] [Google Scholar]
- Clariá, J. J., Lapasset, E., & Minniti, D. 1989, A&AS, 78, 363 [NASA ADS] [Google Scholar]
- Clegg, R. E. S., Tomkin, J., & Lambert, D. L. 1981, ApJ, 250, 262 [NASA ADS] [CrossRef] [Google Scholar]
- de Medeiros, J. R., Udry, S., Burki, G., & Mayor, M. 2002, A&A, 395, 97 [NASA ADS] [CrossRef] [EDP Sciences] [Google Scholar]
- Denisenkov, P. A., & Ivanov, V. V. 1987, Sov. Astron. Lett., 13, 214 [Google Scholar]
- Drake, J. J., & Smith, G. 1991, MNRAS, 250, 89 [NASA ADS] [Google Scholar]
- Drake, N. A., & Pereira, C. B. 2008, AJ, 135, 1070 [NASA ADS] [CrossRef] [Google Scholar]
- Drake, N. A., & Pereira, C. B. 2011, A&A, 531, A133 [NASA ADS] [CrossRef] [EDP Sciences] [Google Scholar]
- Edvardsson, B., Andersen, J., Gustafsson, B., et al. 1993, A&A, 275, 101 [NASA ADS] [Google Scholar]
- Ford, A., Jeffries, R. D., & Smalley, B. 2005, MNRAS, 364, 272 [NASA ADS] [CrossRef] [Google Scholar]
- Friel, E. D., Jacobson, H. R., & Pilachowski, C. A. 2005, AJ, 129, 2725 [CrossRef] [Google Scholar]
- Friel, E. D., Jacobson, H. R., & Pilachowski, C. A. 2010, AJ, 139, 1942 [NASA ADS] [CrossRef] [Google Scholar]
- Frye, R. L., MacConnell, D. J., & Humpherys, R. M. 1970, PASP, 82, 1360 [NASA ADS] [CrossRef] [Google Scholar]
- Fulbright, J. P. 2000, AJ, 120, 1841 [NASA ADS] [CrossRef] [Google Scholar]
- Gilroy, K. K. 1989, ApJ, 347, 835 [CrossRef] [Google Scholar]
- González, J. F., & Lapasset, E. 2001, AJ, 121, 2657 [CrossRef] [Google Scholar]
- Gonzalez, G., & Wallerstein, G. 2000, PASP, 112, 1081 [NASA ADS] [CrossRef] [Google Scholar]
- Gratton, R. G., & Contarini, G. 1994, A&A, 283, 911 [NASA ADS] [Google Scholar]
- Gratton, R. G., & Sneden, C. 1988, A&A, 204, 193 [NASA ADS] [Google Scholar]
- Gratton, R. G., Carretta, E., Eriksson, K., & Gustafsson, B. 1999, A&A, 350, 955 [NASA ADS] [Google Scholar]
- Grevesse, N., & Sauval, A. J. 1998, SSRv, 85, 161 [NASA ADS] [Google Scholar]
- Hill, V., & Pasquini, L. 1999, A&A, 348, L21 [NASA ADS] [Google Scholar]
- Hill, V., Andrievsky, S., & Spite, M. 1995, A&A, 293, 347 [NASA ADS] [Google Scholar]
- Hobbs, L. M., Thorburn, J. A., & Rebull, L. M. 1999, ApJ, 523, 797 [NASA ADS] [CrossRef] [Google Scholar]
- Iben, I. 1966, ApJ, 71, 858 [NASA ADS] [Google Scholar]
- Iben, I. 1967, ApJ, 147, 624 [NASA ADS] [CrossRef] [Google Scholar]
- Jacobson, H. R., Friel, E. D., & Pilachowski, C. A. 2008, AJ, 135, 2341 [NASA ADS] [CrossRef] [Google Scholar]
- Jacobson, H. R., & Pilachowski, C. A., & Friel, E. D. 2011, AJ, 142, 59 [NASA ADS] [CrossRef] [Google Scholar]
- Jankowitz, N. E., & McCosh, C. J. 1963, MNSSA, 22, 18 [NASA ADS] [Google Scholar]
- Kaufer, A., Stahl, O., Tubbesing, S., et al. 1999, The Messenger, 95, 8 [Google Scholar]
- Kurucz, R. L. 1993, CD-ROM 13, Atlas9 Stellar Atmosphere Programs and 2 km s-1 Grid (Cambridge: Smithsonian Astrophys. Obs) [Google Scholar]
- Lambert, D. L. 1981, The chemical composition of red giants – The first dredge-up phase, eds. I. Iben, & Renzini, in Physical Process in Red Giants (Dordrecht: D. Reidel Publ. Co.), 115 [Google Scholar]
- Lambert, D. L., Heath, J. E., Lemke, M., & Drake, J. 1996, ApJS, 103, 183 [NASA ADS] [CrossRef] [Google Scholar]
- Luck, R. E. 1994, ApJS, 91, 309 [NASA ADS] [CrossRef] [Google Scholar]
- Luck, R. E., & Heiter, U. 2007, AJ, 133, 2464 [Google Scholar]
- Maiorca, E., Randich, S., Busso, M., Magrini, L., & Palmerini, S. 2011, ApJ, 736, 120 [NASA ADS] [CrossRef] [Google Scholar]
- Martin, G. A., Fuhr, J. R., & Wiese, W. L. 1988, J. Phys. Chem. Ref. Data, 17, 4 [Google Scholar]
- Martin, W. C., Fuhr, J. R., Kelleher, D. E., et al. 2002, NIST Atomic Spectra Database Version2.0 (Online Available), NIST Standard Reference Database, National Institute of Standards and Technology, Gaithersburg Marylan [Google Scholar]
- McWilliam, A., & Rich, M. R. 1994, ApJS, 91, 749 [NASA ADS] [CrossRef] [Google Scholar]
- Melo, C. H. F., Pasquini, L., & de Medeiros, J. R. 2001, A&A, 375, 851. [NASA ADS] [CrossRef] [EDP Sciences] [Google Scholar]
- Mermilliod, J. C., Mayor, M., & Udry, S. 2008, A&A, 485, 303 [NASA ADS] [CrossRef] [EDP Sciences] [Google Scholar]
- Mikolaitis, Š., Tautvaišienė, G., Gratton, R., Bragaglia, A., & Carretta, E. 2010, MNRAS, 407, 1866 [NASA ADS] [CrossRef] [Google Scholar]
- Mikolaitis, Š., Tautvaišienė, G., Gratton, R., Bragaglia, A., & Carretta, E. 2011a, MNRAS, 416, 1092 [NASA ADS] [CrossRef] [Google Scholar]
- Mikolaitis, Š., Tautvaišienė, G., Gratton, R., Bragaglia, A., & Carretta, E. 2011b, MNRAS, 413, 2199 [NASA ADS] [CrossRef] [Google Scholar]
- Mikolaitis, Š., Tautvaišienė, G., Gratton, R., Bragaglia, A., & Carretta, E. 2012, A&A, 541, A137 [NASA ADS] [CrossRef] [EDP Sciences] [Google Scholar]
- Mishenina, T. V., Bienaymé, O., Gorbaneva, T. I., et al. 2006, A&A, 456, 1109 [NASA ADS] [CrossRef] [EDP Sciences] [Google Scholar]
- Mishenina, T. V., Gorbaneva, T. I., Bienaymé, O., et al. 2007, Astron. Rep., 51, 382 [NASA ADS] [CrossRef] [Google Scholar]
- Pace, G., Danziger, J., Carraro, G., et al. 2010, A&A, 515, A28 [NASA ADS] [CrossRef] [EDP Sciences] [Google Scholar]
- Pancino, E., Carrera, R., Rossetti, E., & Gallart, C. 2010, A&A, 511. A56 [Google Scholar]
- Pasquini, L., Randich, S., & Pallavicini, R. 2001, A&A, 374, 1017 [NASA ADS] [CrossRef] [EDP Sciences] [Google Scholar]
- Pasquini, L., Randich, S., Zoccali, M., et al. 2004, A&A, 424, 951 [NASA ADS] [CrossRef] [EDP Sciences] [Google Scholar]
- Paunzen, E., Pintado, O. I., & Maitzen, H. M. 2003, A&A, 412, 721 [NASA ADS] [CrossRef] [EDP Sciences] [Google Scholar]
- Pavlenko, Ya. V., Jenkins, J. S., Jones, H. R. A., Ivanyuk, O., & Pinfield, D. J., 2012, MNRAS, 422, 542 [NASA ADS] [CrossRef] [Google Scholar]
- Pereira, C. B., & Drake, N. A. 2009, A&A, 496, 791 [NASA ADS] [CrossRef] [EDP Sciences] [Google Scholar]
- Preston, G. W., & Sneden, C. 2001, AJ, 122, 1545 [Google Scholar]
- Reddy, B. E., Bakker, E. J., & Hrivnak, B. J. 1999, ApJ, 524, 831 [NASA ADS] [CrossRef] [Google Scholar]
- Reddy, B. E., Tomkin, J., Lambert, D. L., & Allen de Prieto, C. 2003, MNRAS, 340, 304 [NASA ADS] [CrossRef] [Google Scholar]
- Reddy, A. B. S., Giridhar, S., & Lambert, D. L. 2012, MNRAS, 419, 1350 [CrossRef] [Google Scholar]
- Sagar, R., & Sharples, R. M. 1991, A&AS, 88, 47 [NASA ADS] [Google Scholar]
- Santos, N. C., Lovis, C., Pace, G., Melendez, J., & Naef, D. 2009, A&A, 493, 309 [NASA ADS] [CrossRef] [EDP Sciences] [Google Scholar]
- Schaller, G., Schaerer, D., Meynet, G., & Maeder, A. 1992, A&AS, 96, 269 [Google Scholar]
- Schneider, H., & Weiss, W. W. 1988, A&AS, 75, 353 [NASA ADS] [Google Scholar]
- Smiljanic, R., Gauderon, R., North, P., et al. 2009, A&A, 502, 267 [NASA ADS] [CrossRef] [EDP Sciences] [Google Scholar]
- Smith, G., Edvardsson, B., & Frisk, U. 1986, A&A, 165, 126 [NASA ADS] [Google Scholar]
- Smith, V. V., Cunha, K., & Lambert, D. L. 1995, AJ, 110, 2827 [Google Scholar]
- Smith, V. V., Lambert, D. L., & Nissen, P. E. 1998, ApJ, 506, 405 [Google Scholar]
- Smith, V. V., Cunha, K., Jorissen, A., & Boffin, H. M. J. 1996, A&A, 315, 179 [NASA ADS] [Google Scholar]
- Sneden, C. 1973, Ph.D. Thesis, Univ. of Texas [Google Scholar]
- Sneden, C., McWilliam, A., Preston, G. W., et al. 1996, ApJ, 467, 819 [NASA ADS] [CrossRef] [Google Scholar]
- Stancliffe, R. J., Glebbeek, E., Izzard, R. G., & Pols, O. R. 2007, A&A, 464, L57 [NASA ADS] [CrossRef] [EDP Sciences] [Google Scholar]
- Stütz, Ch., Bagnulo, S., Jehin, E., et al. 2006, A&A, 451, 285 [NASA ADS] [CrossRef] [EDP Sciences] [Google Scholar]
- Tautvaišienė, G., Edvardsson, B., Tuominen, I., & Ilyin, I. 2000, A&A, 360, 499 [Google Scholar]
- Tautvaišienė, G., Edvardsson, B., Puzeras, E., & Ilyin, I. 2005, A&A, 431, 933 [NASA ADS] [CrossRef] [EDP Sciences] [Google Scholar]
- Tautvaišienė, G., Edvardsson, B., Puzeras, E., Barisevičius, G., & Ilyin, I. 2010, MNRAS, 509, 1213 [Google Scholar]
- Tomkin, J., & Lambert, D. L. 1984, ApJ, 279, 220 [NASA ADS] [CrossRef] [Google Scholar]
- Twarog, B. A., Ashman, K. M., & Anthony-Twarog, B. J. 1997, AJ, 114, 2556 [NASA ADS] [CrossRef] [Google Scholar]
- van Winckel, H., & Reyniers, M. 2000, A&A, 345, 135 [Google Scholar]
- Villanova, S., Carraro, G., & Saviane, I. 2009, A&A, 504, 845 [NASA ADS] [CrossRef] [EDP Sciences] [Google Scholar]
- Wiese, W. L., Smith, M. W., & Miles, B. M. 1969, NBS Ref. Data. Ser. [Google Scholar]
- Yong, D., Carney, B. W., & Teixera de Almeida, M. L. 2005, AJ, 130, 579 [Google Scholar]
- Začs, L., Alksnis, O., Barzdis, A., et al. 2011, MNRAS, 417, 649 [CrossRef] [Google Scholar]
All Tables
Effect of errors in atmospheric parameters and carbon, oxygen, and nitrogen abundances on the CNO abundances.
All Figures
|
Fig. 1 Reddening corrected color–magnitude diagram of NGC 3114. Black filled circles are kinematically main-sequence member stars from Tables 2 and 3 of González & Lapasset (2001). Our program stars are identified by red filled squares. We also show the isochrone of Bertelli et al. (1994) for log t = 8.2 (0.16 Gyr), Z = 0.02, and Y = 0.28. |
| In the text | |
|
Fig. 2 Observed (dotted red line) and synthetic (solid blue line) spectra of HD 87109 in the region around the oxygen forbidden line at λ6300 Å. The synthetic spectra were calcultaed with the oxygen abundances of [O/Fe] = −0.30, − 0.20, and − 0.10. |
| In the text | |
|
Fig. 3 Observed (dotted red line) and synthetic (solid blue line) spectra of the star HD 87109 in the region containing the 12CN and the 13CN molecular lines. In the synthetic spectra we show the synthesis for three values of 12C/13C ratios, 12.0, 21.0, and 36.0. The light blue solid line shows the spectrum of the hot star used to map the telluric water lines. |
| In the text | |
|
Fig. 4 Normalized spectra of HD 87566, HD 87833, HD 304864, and HD 87479 with some identified absorption lines. HD 87566 has a low rotational velocity vsini < 4.5 km s-1. In the spectra of HD 87833, HD 304864, and HD 87479 we see the absorption lines broadened by the rotation velocity of 8.0 km s-1, 11 km s-1, and 15 km s-1. |
| In the text | |
|
Fig. 5 Projected rotational velocities for giant stars as a function of photometric temperature. The open squares represent the stars from the sample studied by Carlberg et al. (2011) and the red squares the stars HD 87479 and HD 304864. |
| In the text | |
|
Fig. 6 Abundance ratios [X/Fe] versus [Fe/H]. Red squares: cluster giants of NGC 3114; blue crosses: field giants of Luck & Heiter (2007); black crosses: clump giants of Mishenina et al. (2006); yellow crosses: clump giants of Tautvaišienė et al. (2010); green filled squares: mean abundances of other open clusters (with ages higher than 1.0 Gyr); green open squares: clusters with ages less than 1.0 Gyr. Data from young clusters were taken from Smiljanic et al. (2009; IC 4756, NGC 3532, NGC 2447, NGC 2360, NGC 6281, NGC 6633); Pancino et al. (2010; NGC 2099); Jacobson et al. (2011; NGC 1245 and NGC 1817); Carrera & Pancino (2011; Hyades and Praesepe); Začs et al. (2011; NGC 1545 and Tr 2); Villanova et al. (2009; NGC 6475); Brown et al. (1996; Mellote 71). Data from old clusters were taken from Pacino et al. (2010; NGC 2420, NGC 7789, Cr 100, M 67); Carrera & Pancino (2011; Berkeley 32 and NGC 752); Jacobson et al. (2011; NGC 2158); Jacobson et al. (2008; NGC 7142); Friel et al. (2010; NGC 188 and Berkeley 39); Carretta et al. (2005; Cr 261); Gratton & Contarini (1994; Mellote 66 and NGC 2243); Friel et al. (2005; Berkeley 17); Young et al. (2005; Berkeley 20 and Berkeley 29). |
| In the text | |
|
Fig. 7 The 12C/13C ratio in giants of open clusters versus the turn-off mass. Data points represent the isotopic ratio for each star of the cluster. Filled circles are data from Gilroy (1989), open squares data from Smiljanic et al. (2009), and crosses data from Mikolaitis et al. (2011a,b, 2012). Red squares represent the stars of NGC 3114. The theoretical 12C/13C ratio as a function of stellar mass is taken from the models of Schaller et al. (1992), black solid line. Other models from Charbonnel & Lagarde (2010) are also shown: standard, red solid line; thermohaline mixing, blue solid line; thermohaline and rotation-induced mixing with 110 km s-1, blue short-dashed line; thermohaline and rotation-induced mixing with 250 km s-1, blue long-dashed line. |
| In the text | |
|
Fig. 8 Abundance ratios [X/Fe] versus [Fe/H]. Symbols have the same meaning as in Fig. 6. In addition we provide results for yttrium (open squares; Fulbright 2000) and neodymium (filled circles, Edvardsson et al. 1993) for dwarf stars to compare with the abundances of HD 87526. |
| In the text | |
|
Fig. 9 Mean s-process abundances versus age for NGC 3114 compared with a sample of the open clusters analyzed by Maiorca et al. (2001). |
| In the text | |
Current usage metrics show cumulative count of Article Views (full-text article views including HTML views, PDF and ePub downloads, according to the available data) and Abstracts Views on Vision4Press platform.
Data correspond to usage on the plateform after 2015. The current usage metrics is available 48-96 hours after online publication and is updated daily on week days.
Initial download of the metrics may take a while.