Fig. 7
Download original image
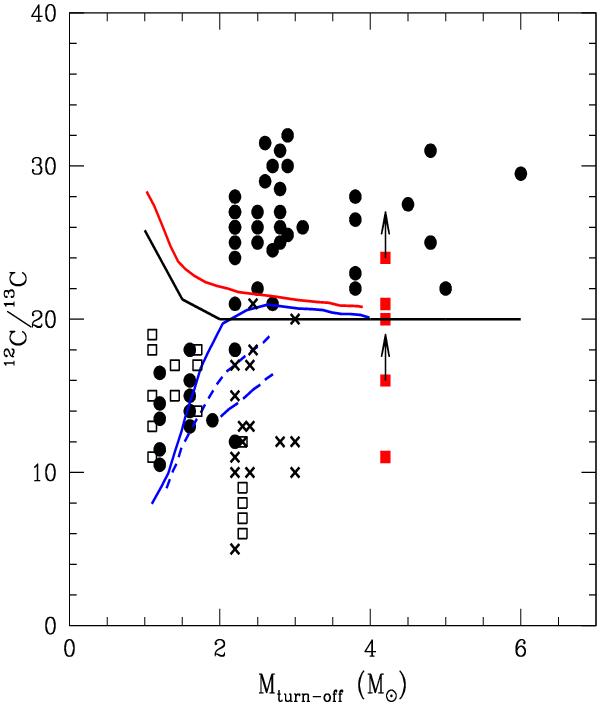
The 12C/13C ratio in giants of open clusters versus the turn-off mass. Data points represent the isotopic ratio for each star of the cluster. Filled circles are data from Gilroy (1989), open squares data from Smiljanic et al. (2009), and crosses data from Mikolaitis et al. (2011a,b, 2012). Red squares represent the stars of NGC 3114. The theoretical 12C/13C ratio as a function of stellar mass is taken from the models of Schaller et al. (1992), black solid line. Other models from Charbonnel & Lagarde (2010) are also shown: standard, red solid line; thermohaline mixing, blue solid line; thermohaline and rotation-induced mixing with 110 km s-1, blue short-dashed line; thermohaline and rotation-induced mixing with 250 km s-1, blue long-dashed line.
Current usage metrics show cumulative count of Article Views (full-text article views including HTML views, PDF and ePub downloads, according to the available data) and Abstracts Views on Vision4Press platform.
Data correspond to usage on the plateform after 2015. The current usage metrics is available 48-96 hours after online publication and is updated daily on week days.
Initial download of the metrics may take a while.