Fig. 8
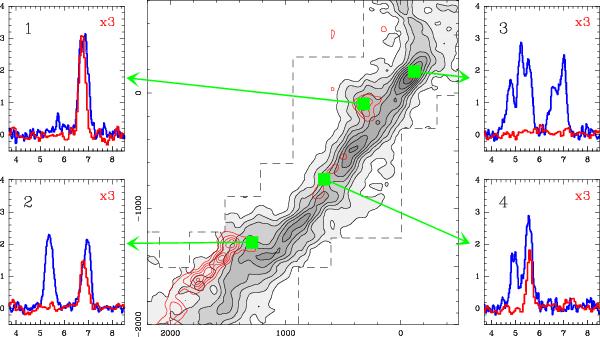
Central panel: FCRAO integrated intensity maps of the B211-B213 region in C18O(1−0) (gray scale and black contours) and N2H+(1−0) (red contours). Left and right panels: spectra from selected positions illustrating the complex velocity structure of the emission. The blue spectra correspond to C18O(2−1) and the red spectra correspond to the isolated (F1F = 01–12) component of N2H+(1−0) (multiplied by 3) observed simultaneously with the IRAM 30 m telescope. Note the presence of 5 different C18O peaks in panel 3.
Current usage metrics show cumulative count of Article Views (full-text article views including HTML views, PDF and ePub downloads, according to the available data) and Abstracts Views on Vision4Press platform.
Data correspond to usage on the plateform after 2015. The current usage metrics is available 48-96 hours after online publication and is updated daily on week days.
Initial download of the metrics may take a while.