Fig. A.3
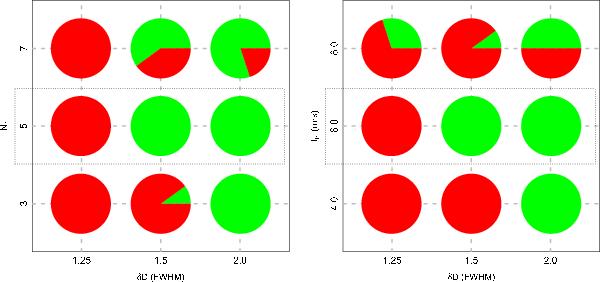
“Traffic-light” diagrams for a model with two cloud components that have the same velocity but are separated in the plane of the sky. Left: rates of success (green) and failure (red) for a matrix of separation between components (in units of axial FWHM, x-axis) and number of neighbors used in the friend definition (y-axis) Righ: same as in left panel but for models of variable intensity threshold (in units of rms). The horizontal boxes enclose the results for the choice of parameters favored by our modeling. (All models assume a gradient of 3 km s-1 pc-1, as recommended by the results shown in Fig. A.2, and for each panel, the best choice of the other panel is used.)
Current usage metrics show cumulative count of Article Views (full-text article views including HTML views, PDF and ePub downloads, according to the available data) and Abstracts Views on Vision4Press platform.
Data correspond to usage on the plateform after 2015. The current usage metrics is available 48-96 hours after online publication and is updated daily on week days.
Initial download of the metrics may take a while.