Fig. 12
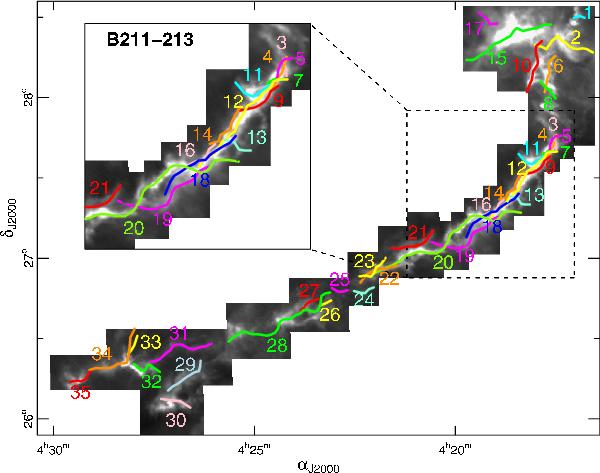
Location of the cloud components of L1495/B213 identified with the FIVE algorithm. Each component is represented by its central axis and has been color-coded for easier identification. The background gray-scale image is a SPIRE 250 μm continuum map from the Gould Belt Survey (André et al. 2010) that has been blanked out to match the coverage of our FCRAO data.
Current usage metrics show cumulative count of Article Views (full-text article views including HTML views, PDF and ePub downloads, according to the available data) and Abstracts Views on Vision4Press platform.
Data correspond to usage on the plateform after 2015. The current usage metrics is available 48-96 hours after online publication and is updated daily on week days.
Initial download of the metrics may take a while.