Fig. 11
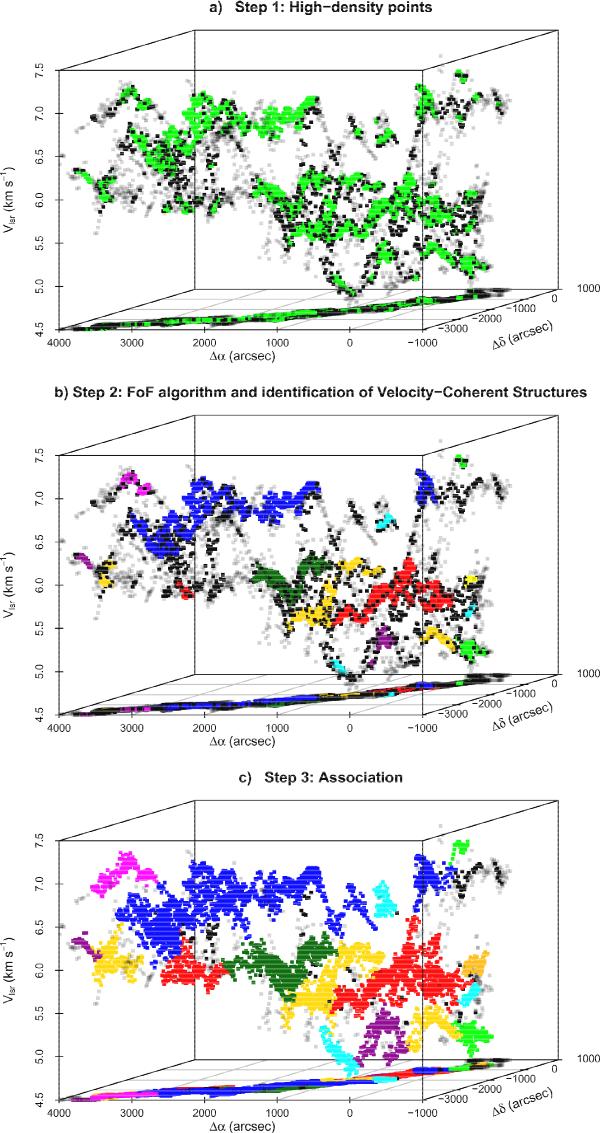
Analysis of the PPV cube of Fig. 9 using the FIVE algorithm. Top: seed points selected using the threshold values described in the text (color-coded green). Middle: points identified after a friends-of-friends search that starts with the seed points from the previous step. The color coding illustrates the different cloud components. Bottom: final assignment of points to the different cloud components (colored points). The black points represent unassigned points.
Current usage metrics show cumulative count of Article Views (full-text article views including HTML views, PDF and ePub downloads, according to the available data) and Abstracts Views on Vision4Press platform.
Data correspond to usage on the plateform after 2015. The current usage metrics is available 48-96 hours after online publication and is updated daily on week days.
Initial download of the metrics may take a while.