Fig. 10
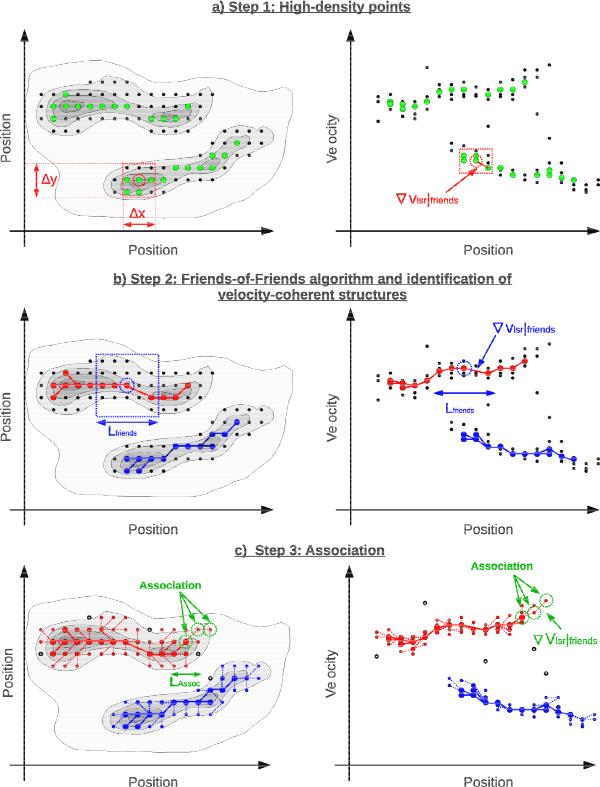
Schematic view of the 3 steps in the modified FoF method used to identify components in PPV space. To simplify the view, two projections of the PPV cube are presented. The left panels show the PP plane (integrated map) and the right panels show a projection on a PV plane. The black points represent all data with S/N ≥ 3. The green points in the first row of panels are those selected as significant to use in the first application of the FoF algorithm. The red and blue colors in the lower panels indicate positions belonging to each of the two structures identified by FoF as connected. The colored lines indicate the individual connection between points. Points are gradually assigned to the two velocity structures. The boxes illustrate the regions used to calculate the number of neighbor points and the velocity gradients for the FoF algorithm.
Current usage metrics show cumulative count of Article Views (full-text article views including HTML views, PDF and ePub downloads, according to the available data) and Abstracts Views on Vision4Press platform.
Data correspond to usage on the plateform after 2015. The current usage metrics is available 48-96 hours after online publication and is updated daily on week days.
Initial download of the metrics may take a while.