| Issue |
A&A
Volume 554, June 2013
|
|
|---|---|---|
| Article Number | A51 | |
| Number of page(s) | 8 | |
| Section | Extragalactic astronomy | |
| DOI | https://doi.org/10.1051/0004-6361/201219521 | |
| Published online | 04 June 2013 | |
The ultraviolet/optical variability of steep-spectrum radio quasars: the change in accretion rate?⋆
Key Laboratory for Research in Galaxies and Cosmology, Shanghai Astronomical Observatory, Chinese Academy of Sciences, 80 Nandan Road, 200030 Shanghai, PR China
e-mail: This email address is being protected from spambots. You need JavaScript enabled to view it.
Received: 2 May 2012
Accepted: 9 April 2013
Abstract
Context. The steep-spectrum radio quasars (SSRQs) are powerful radio sources, with thermal emission from accretion disk and jet nonthermal emission both likely contributing to the ultraviolet (UV)/optical luminosity; however, the former may play a dominant role. Since the UV/optical variability of SSRQs has been poorly studied, little is known about the mechanism of their variability.
Aims. We investigate the mechanism of the UV/optical variability of SSRQs.
Methods. A sample of eighteen SSRQs was established in SDSS Stripe 82 region in our previous works, in which the flux and spectral variability were studied. In this work, we construct the flux-flux diagram using SDSS u and i multi-epoch data for these eighteen SSRQs. The standard accretion disk model is used to fit the flux-flux variations, in order to explore the variability mechanism.
Results. The model fit to flux-flux diagram are tuned with fixed black hole mass and varying accretion rate. We find that the flux-flux diagram of all our SSRQs can be qualitatively described by the standard accretion disk model with a change in the accretion rate. Although nonthermal jet power-law emission can also qualitatively reproduce the variability, the reasonable accretion rates and black hole masses required to fit the flux-flux variations suggest that a disk emission with variable accretion rate is a plausible description of the data.
Key words: galaxies: active / quasars: general / galaxies: photometry
Full Fig. 1 is available in electronic form at http://www.aanda.org
© ESO, 2013
1. Introduction
Although radio-loud active galactic nuclei (AGNs) only represent 10% of the whole AGNs population (e.g. Kellermann et al. 1989), they are still important in AGN study, for example, to study the jet production, composition, collimation, and even the feedback to the environment. Two subsets of radio-loud AGNs, flat-spectrum radio quasars (FSRQs) and steep-spectrum radio quasars (SSRQs), are different in many respects. FSRQs together with BL Lac objects, so called blazars, are the most extreme class of AGNs, characterized by strong and rapid variability, high polarization, and apparent superluminal motion. These extreme properties are generally interpreted as the consequence of nonthermal emission from a relativistic jet oriented close to the line of sight, which can explain the large core dominance in FSRQs in general. In contrast, the SSRQs are usually lobe-dominated radio quasars, and the radio lobe emission dominates the radio core emission. Their jets are viewed at larger angles than blazars; as a result, the beaming effects of jets are not severe (see e.g. Liu et al. 2006), and the jet emission is not expected to dominate at optical bands (e.g. Gu & Ai 2011a,b).
AGNs exhibit variability at almost all wavelengths (e.g. Wiita 1996; Vanden Berk et al. 2004). Multiwavelength studies of variations in the radiation emitted from AGNs have played important roles in exploring the physical conditions near the center of AGNs. There have been extensive studies of the optical variability of blazars (e.g. Ghisellini et al. 1997; Fan et al. 1998; Massaro et al. 1998; Ghosh et al. 2000; Clements & Carini 2001; Raiteri et al. 2001; Villata et al. 2002; Vagnetti et al. 2003; Wu et al. 2005, 2007; Gu et al. 2006; Hu et al. 2006; Poon et al. 2009; Rani et al. 2010; Gu & Ai 2011a). While it is generally accepted that the nonthermal emission from relativistic jet oriented close to the line of sight dominates the optical continuum, the situation seems more complicated in FSRQs, with the evidence of thermal emission in FSRQs (e.g. Pian et al. 1999; Grandi & Palumbo 2004; Raiteri et al. 2007; D’Ammando et al. 2011), and the redder-when-brighter trend found in several FSRQs (e.g. Gu et al. 2006; Rani et al. 2010; Gu & Ai 2011a; Wu et al. 2011).
Intrinsically, the variations in the brightnesses of AGNs are generally caused by physical variations in the jet and accretion disk. However, the contribution of each component to the observed variability varies from source to source. The properties of steep-spectrum radio quasars (SSRQs) are in-between those of both FSRQs and radio-quiet quasars. Therefore, it is not clear whether the jet nonthermal or accretion thermal emission is primarily responsible for the variation in SSRQs, even the situation can be more complicated if two components are mixed together with comparable contribution. However, the optical and spectral variations of SSRQs have been poorly studied, and few explanations have been presented (e.g. Stalin et al. 2004, 2005; Gu & Ai 2011b), in comparison to many investigations in radio-quiet AGNs (e.g. Stalin et al. 2004, 2005; Gupta & Joshi 2005; Wilhite et al. 2005; Ai et al. 2010) and FSRQs. The optical variability of SSRQs has been recently investigated by Gu & Ai (2011b) for a sample of eighteen SSRQs assembled from SDSS Stripe 82 region. As shown in Gu & Ai (2011b), the Mg II line to continuum luminosity ratio and the anti-correlation between the variability at r band and the Eddington ratio of SSRQs are all similar to those of radio-quiet AGNs. These results strongly argued that the thermal emission from accretion disk might be the dominant one in the optical continuum, and it may be responsible for the variability of SSRQs. In terms of the long-term variability, the change in accretion rate is used to explain the optical variations in radio quiet AGNs (e.g. Li & Cao 2008). In this work, we investigate whether the change of accretion rate in standard accretion disk model can well describe the ultraviolet (UV)/optical variability of SSRQs.
The layout of this paper is as follows: in Sect. 2, we describe the source sample; the results of model fit to the flux variations are outlined in Sect. 3; Sect. 4 includes the discussion; and in the last section, we draw our conclusions. The cosmological parameters H0 = 70 km s-1 Mpc-1, Ωm = 0.3, and ΩΛ = 0.7 are used throughout the paper, and the spectral index α is defined as fν ∝ ν− α, where fν is the flux density at frequency ν.
2. Sample
Our sample of eighteen SSRQs consists of five SSRQs in Gu & Ai (2011a) and thirteen SSRQs in Gu & Ai (2011b). The initial quasar sample was selected as those quasars in both the SDSS DR7 quasar catalog (Schneider et al. 2010) and Stripe 82 region. The SDSS DR7 quasar catalog consists of 105 783 spectroscopically confirmed quasars with luminosities brighter than Mi = − 22.0, with at least one emission line having a full width at half-maximum (FWHM) larger than 1000 km s-1 and highly reliable redshifts. The sky coverage of the sample is about 9380 deg2 and the redshifts range from 0.065 to 5.46. The five-band (u, g, r, i, z) magnitudes have typical errors of about 0.03 mag. The spectra cover the wavelength range from 3800 Å to 9200 Å with a resolution of ≃2000 (see Schneider et al. 2010, for details). The Stripe 82 region extending over right ascension α = 20h − 4h and declination − 1°.25 < δ < + 1°.25, was repeatedly scanned during the SDSS-I phase (2000–2005) under generally photometric conditions. This region was also scanned repeatedly over the course of three three-month campaigns in three successive years in 2005–2007, as part of the SDSS Supernova Survey (SN survey). The data are well calibrated (Lupton et al. 2002).
We cross-correlate the initial quasar sample with the Faint Images of the Radio Sky at Twenty centimeters (FIRST) 1.4-GHz radio catalog (Becker et al. 1995), the Green Bank 6-cm (GB6) survey at 4.85 GHz radio catalog (Gregory et al. 1996), and the Parkes-MIT-NRAO (PMN) radio continuum survey at 4.85 GHz (Griffith & Wright 1993). The initial quasar sample was first cross-correlated with the SDSS quasar positions and the FIRST catalog to within 2 arcsec (see e.g. Ivezić et al. 2002; Lu et al. 2007). The resulting sample of SDSS quasar positions was then cross-correlated with both the GB6 and PMN equatorial catalogs to within 1 arcmin (e.g. Kimball & Ivezić 2008). Owing to the different spatial resolutions of FIRST, GB6, and PMN, single or multiple FIRST counterparts were found to within 1 arcmin, although only a single GB6 and/or PMN counterpart existed. The radio spectral index αr was then calculated between the single or integrated FIRST and/or NRAO VLA Sky Survey (NVSS) 1.4 GHz within 1 arcmin and either or both of the GB6 and PMN 4.85 GHz (see details in Gu & Ai 2011a,b). We define a quasar to be an SSRQ according to its radio spectral index αr > 0.5. Finally, five SSRQs with single FIRST counterpart to within 1 arcmin of the SDSS positions were presented in Gu & Ai (2011a), while thirteen SSRQs with multiple FIRST counterparts were listed in Gu & Ai (2011b). To have the radio spectral information, we decided to consider only the sources with a radio counterpart in both 1.4 and 4.85 GHz radio images. In spite of this, our final sample, although not complete, still includes quite a large number (18) of SSRQs.
Source list.
The source sample is listed in Table 1, in which the black hole mass and the Eddington ratio from Gu & Ai (2011b) are shown. In calculating the Eddington ratio, the bolometric luminosity is estimated as LBol = 10 LBLR (Netzer 1990), in which the broad line region (BLR) luminosity LBLR is derived following Celotti et al. (1997) by scaling the strong broad emission lines Hβ, Mg II, and C IV to the quasar template spectrum of Francis et al. (1991), in which Lyα is used as a flux reference of 100.
The multi-epoch photometric observations in the Stripe 82 region enable us to investigate the optical variability of the selected quasars. As in Gu & Ai (2011a,b), we directly used the point-spread-function magnitudes in the Catalog Archive Server (CAS) Stripe82 database from the photometric data obtained during the SDSS-I phase from data release 7 (DR7; Abazajian et al. 2009) and the SN survey during 2005–2007. We selected the sources classified as point sources in all observational runs, and only data with good measurements (high-quality photometry) were selected, of which the ugriz magnitude are required to be brighter than the magnitude limit. Finally, the data taken in cloudy conditions were also excluded.
3. Results
Besides the conventional flux versus color relation, the flux-flux relation has been applied to examining the color variability for quasars (e.g. Sakata et al. 2011; Schmidt et al. 2012). In this work, to obtain a wide wavelength coverage when investigating the spectral variability, the u and i magnitude in the same night are used to plot flux-flux diagram. The reason for using i magnitude instead of the z magnitude as the longest wavelength is that the signal-to-noise ratio is much higher in the former than in the latter for most targets. The corresponding wavelength of SDSS u and i waveband in the source rest frame are shown in Table 1.
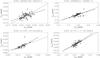 |
Fig. 1 Flux-flux diagram for our SSRQs represented by the rest frame flux density at frequencies corresponding to λu for y- and λi (see Table 1) for x-axis. The dotted line is the best fit standard accretion disk model with varied mass accretion rates and a constant black hole mass, and the dash-dotted line represents the best fit of a power law. The solid circles with error bars represent the multi-epoch flux data. The end of the figure is available online. |
The Eddington ratio LBol/LEdd of all SSRQs is − 2.0 < log LBol/LEdd < 0 except for three sources (SDSS J213004.75-010244.4, SDSS J012517.14-001828.9, and SDSS J015832.51-004238.2, see Table 1), which is indicative of a standard thin disk (Shakura & Sunyaev 1973) being present in SSRQs. The low LBol/LEdd in SDSS J213004.75-010244.4 and the high values in SDSS J012517.14-001828.9 and SDSS J015832.51-004238.2 make the standard thin disk hardly applicable. However, the estimation of Eddington ratio is subject to large uncertainties both in black hole mass and BLR luminosity (see Sect. 4). The standard accretion disk model used in Li & Cao (2008) has successfully explained the correlation between the optical-UV variability amplitude and black hole mass found in Wold et al. (2007) and Wilhite et al. (2008). We directly adopted the model of Li & Cao (2008), except that the temperature distribution (Eq. (1) in Li & Cao 2008) was modified as ![Mathematical equation: \begin{equation} T_{\rm eff} (r)=\left\{\frac{3GM \dot{M}}{8\pi \sigma r^3}\left[1-\left(\frac{r_{\rm in}}{r}\right)^{1/2}\right]\right\}^{1/4} \end{equation}](/articles/aa/full_html/2013/06/aa19521-12/aa19521-12-eq99.png) (1)(Frank et al. 2002). The temperature distribution in Li & Cao (2008) represents the disk temperature on the equatorial plane. In contrast, the temperature distribution we used here (in Eq. (1)) describes the radial dependence of the effective temperature derived from the emergent flux from an accretion disk, which is more appropriate for our purpose. We calculated accretion-disk spectra assuming a steady geometrically thin, optically thick accretion disk (Shakura & Sunyaev 1973). In this case the emitted flux is independent of viscosity, and each element of the disk face radiates roughly as a blackbody with a characteristic temperature that only depends on the mass of the black hole MBH, the mass accretion rate Ṁ, and the radius of the innermost stable orbit (Peterson 1997; Frank et al. 2002). We adopted the Schwarzschild geometry (nonrotating black hole), and for this the innermost stable orbit is at rin = 6rg, where rg is the gravitational radius defined as rg = GMBH/c2, G the gravitational constant, and c the speed of light. Unlike blazars, SSRQs are expected to have the jet pointed away from the observer. We assumed that the disk is viewed with an inclination angle of 20°, which is the mean viewing angle of lobe-dominated radio quasars in Gu et al. (2009). The accretion-disk spectrum is fully constrained by the two quantities, the mass accretion rate and the black hole mass.
(1)(Frank et al. 2002). The temperature distribution in Li & Cao (2008) represents the disk temperature on the equatorial plane. In contrast, the temperature distribution we used here (in Eq. (1)) describes the radial dependence of the effective temperature derived from the emergent flux from an accretion disk, which is more appropriate for our purpose. We calculated accretion-disk spectra assuming a steady geometrically thin, optically thick accretion disk (Shakura & Sunyaev 1973). In this case the emitted flux is independent of viscosity, and each element of the disk face radiates roughly as a blackbody with a characteristic temperature that only depends on the mass of the black hole MBH, the mass accretion rate Ṁ, and the radius of the innermost stable orbit (Peterson 1997; Frank et al. 2002). We adopted the Schwarzschild geometry (nonrotating black hole), and for this the innermost stable orbit is at rin = 6rg, where rg is the gravitational radius defined as rg = GMBH/c2, G the gravitational constant, and c the speed of light. Unlike blazars, SSRQs are expected to have the jet pointed away from the observer. We assumed that the disk is viewed with an inclination angle of 20°, which is the mean viewing angle of lobe-dominated radio quasars in Gu et al. (2009). The accretion-disk spectrum is fully constrained by the two quantities, the mass accretion rate and the black hole mass.
We fit the accretion disk model to the flux-flux plots of individual SSRQs with a free parameter of black hole mass and by changing the mass accretion rate Ṁ. The flux-flux diagrams are shown in Fig. 1 represented by the rest frame flux density at frequencies corresponding to λu and λi. The best-fit black hole mass, reduced χ2 values, and the range of the accretion rate ṁ required to reproduce the flux-flux variations are listed in Table 1. The accretion rate ṁ is defined as ṁ = Ṁ/ṀEdd, in which Ṁ is the mass accretion rate from model fit, and ṀEdd is the Eddington accretion rate (the Eddington luminosity  ). Assuming Lbol = 0.1 Ṁc2, the accretion rate ṁ is equal to the Eddington ratio Lbol/LEdd. The standard thin disk seems to roughly describe the observed flux to flux variations. However, the χ2-test values are generally high.
As SSRQs are sources with a jet component, we also tested the possibility that a nonthermal power law emission can cause the observed flux-flux variations. As in the jet dominated blazars where the bluer-when-brighter trend is commonly observed, a power-law function of  was adopted (see Sakata et al. 2011). The fitting of the power-law function to the flux-flux variations is presented in Fig. 1, and the best-fit parameters and the reduced χ2 values are listed in Table 1. We find that the reduced χ2 value of the power-law fit is comparable to the value of the standard thin disk for all quasars, although slightly improved. It seems difficult to distinguish the thermal disk and nonthermal jet emission from a statistical point of view.
4. Discussions
While FSRQs are usually associated with core-dominated radio quasars, SSRQs are generally related to lobe-dominated ones, usually with two large-scale optically thin radio lobes. The beaming effect is usually not strong in SSRQs because of the relatively large viewing angle. As shown in Gu & Ai (2011b), the Mg II line to continuum luminosity ratio and the anti-correlation between the variability at r band and the Eddington ratio of SSRQs are all similar to those of radio-quiet AGNs. These results strongly imply that the thermal emission from accretion disk might be the dominant one in the optical continuum, and it may be responsible for the variability of SSRQs. While the change in accretion rate can qualitatively explain the optical variations in radio-quiet AGNs (e.g. Li & Cao 2008), it is expected that it can also be applied to SSRQs. From a qualitative point of view, accretion rate variations also seem to work for SSRQs. However, according to the χ2-test, only two sources are consistent with this expectation.
Quasars usually have strong broad emission lines (BELs), which could affect the photometry when they are in the SDSS u and i bands. Following Elvis et al. (2012), we find that only the three strongest BELs make contribution larger than 3%, i. e. Lyα, Hα, and Hβ, for a typical bandwidth of 1000 Å for u and i bands (see Eq. (1) and Table 2 of Elvis et al. 2012). Therefore, we only consider these three lines. In our sample, four sources (labeled in Table 1) are contaminated by BELs, with Lyα affects in two sources (SDSS J012401.76+003500.9 and SDSS J213513.10−005243.8), Hα in SDSS J235156.12−010913.3, and Hβ in SDSS J021225.56+010056.1. In principle, the line contribution to the u and i fluxes could be subtracted considering the SDSS spectra or the method proposed by Elvis et al. (2012). However, we prefer not to remove any line contribution. It is quite improbable that the large discrepancy observed between the data and the standard thin disk model can be entirely ascribed to emission line features. A large reduced χ2 (6.4) is also reported for SDSS J022508.07+ 001707.2, which is an SSRQ in the sample without BELs contaminations.
Since the reduced χ2 values are generally high, it is possible that the accretion disk model is oversimplified and that variations in the accretion rate are not sufficient to explain the observed flux variability. As argued by Zuo et al. (2012), the change in accretion rate is important for producing the observed optical variability, but other physical mechanisms still need to be considered in modifying the simple accretion model for quasars. Schmidt et al. (2012) analyzed a large sample of 9093 quasars from the SDSS Stripe 82 region, and claim that on timescales of years quasar variability does not reflect changes in the mean accretion rate, so some other mechanism must be at work, presumably some disk instability. The authors argue that this picture was confirmed by the comparison of the observed color variability to sequences of steady-state accretion disk models with varying accretion rates, which exhibit much less color variability as a function of accretion rate. While this is claimed for quasar ensembles, the thin accretion disk models could well match the data both in color and in the change of color with changing luminosity by changing the accretion rate in some individual objects (see Fig. 11 in Schmidt et al. 2012). In contrast, Sakata et al. (2011) find that the multi-epoch flux-to-flux plots could be fitted well with the standard accretion disk model by changing the mass accretion rate with a constant black hole mass for luminous radio-quiet quasars. However, their sample size is rather small, only containing ten sources. Moreover, Pereyra et al. (2006) find that the composite differential spectrum of two epochs of observations for hundreds of SDSS quasi-stellar objects (QSO) in the rest-frame wavelength range 1300 − 6000 Å can be successfully fitted by the standard thin disk model, provided that their accretion rates vary from one epoch to the next. It should be noted that the composite spectrum only represents the average characteristics of QSOs. It thus is unclear whether the scenario is applicable to the individual objects. Although based on a smaller Stripe 82 region sample, our results agree with Schmidt et al. (2012).
Since our sources are radio emitters, we cannot exclude the jet contributing to the optical/UV emission. The high reduced χ2 values then may naturally reflect the contribution of jet emission in the UV/optical band, in addition to the thermal accretion disk emission. The nonthermal contribution to the MIR luminosity has been investigated for a sample of powerful 3C RR galaxies and quasars with the IRS and MIPS instruments on Spitzer (Cleary et al. 2007). Owing to the low radio-frequency selection, their quasars are mostly steep spectrum sources, including several compact steep spectrum sources (CSS). By fitting the continuum with synchrotron (jet and lobe) and dust components, they found that nonthermal processes can contribute a significant proportion (up to 90%) of the measured infrared emission in some quasars, although they also shown that the nonthermal contribution may not be severe in the sources with lower core dominance (see their Fig. 7), which is typical in SSRQs. However, our disk model results (see Table 1) indicate that the accretion rates of the studied sources generally agree with values expected for standard accretion disks.
According to the Eddington ratio estimated using the bolometric luminosity from BLR, two sources have an Eddington ratio higher than 100.5 ~ 3, and one source (SDSS J213004.75–010244.4) has the Eddington ratio lower than 0.01. In contrast, the disk-model fitted accretion rate of these three sources are all well within the range of the standard thin disk model ≳0.01. The ṁ difference is likely due to the large uncertainties in the black hole mass estimated from BLR luminosity and the empirical relation. We estimate the errors of the model fit black hole masses from the statistical uncertainty of χ2 fitting of the model, which is listed in Table 1. While the error on the MBH estimates from BLR is ~0.4 dex (e.g. Vestergaard & Peterson 2006), the uncertainties of the black hole mass from the accretion disk model fit is much less. The black hole masses estimated from two methods are compared in Fig. 2 for 17 SSRQs, after excluding the low accretion rate source SDSS J013514.39–000703.8. We find that these two masses are generally consistent. Therefore, even though the disk model fits are not acceptable for most of the sources and a power law can also reproduce the observations, the reasonable accretion rates and black hole masses required to fit the flux-flux variations strongly suggest that a disk emission with variable accretion rate is a plausible description of the data.
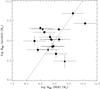 |
Fig. 2 Black hole mass estimated from the empirical relation of BLR radius and the BLR line width compared with the best-fit standard accretion disk model for 17 SSRQs after excluding the source with low accretion rate SDSS J013514.39−000703.8. The solid triangles are four sources with strong emission line contamination in either u or i bands. |
Optical polarimetry could be extremely useful in investigating the nature of optical/UV emission in radio sources. As shown by the recent studies of 3C 120 and 3C 111, the low optical polarization supports the thermal origin of the optical emission (Chatterjee et al. 2009, 2011); however, the detection of polarization percentages of 3% or even higher in 3C 111 suggests that during particular activity phases an additional contribution from nonthermal emission from the jet may be present (Jorstad et al. 2007; Chatterjee et al. 2011). Motivated by this, the polarimetry observations are therefore needed to further explore the jet contribution in the optical band for SSRQs, in addition to the photometric and spectroscopic monitoring.
5. Summary
We explore the flux-flux diagram using SDSS u and i multi-epoch data for a sample of eighteen SSRQs in SDSS Stripe 82 region established in our previous works. The standard accretion disk model is used to fit the flux-flux variations, in order to explore the variability mechanism. We found that the flux-flux diagram of all our SSRQs can be qualitatively described by the standard accretion disk model with change in the accretion rate. Although nonthermal jet power-law emission can also qualitatively reproduce the variability, the reasonable accretion rates and black hole masses required to fit the flux-flux variations suggest that a disk emission with variable accretion rate is a plausible description of the data.
Online material
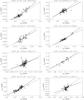 |
Fig. 1 continued. |
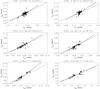 |
Fig. 1 continued. |
Acknowledgments
We thank the referee for constructive comments that greatly improved the manuscript. MFG thanks Y. Ai for the help on data analysis, and S. Shen for helpful discussions. This work is supported by the 973 Program (No. 2009CB824800), and by the National Science Foundation of China (grants 10833002, 10903021, 11073039, and 11233006). Funding for the SDSS and SDSS-II was provided by the Alfred P. Sloan Foundation, the Participating Institutions, the National Science Foundation, the U.S. Department of Energy, the National Aeronautics and Space Administration, the Japanese Monbukagakusho, the Max Planck Society, and the Higher Education Funding Council for England. The SDSS Web site is http://www.sdss.org/
References
- Abazajian, K. N., Adelman-McCarthy, J. K., Agüeros, M. A., et al. 2009, ApJS, 182, 543 [NASA ADS] [CrossRef] [Google Scholar]
- Ai, Y. L., Yuan, W., Zhou, H. Y., et al. 2010, ApJ, 716, L31 [NASA ADS] [CrossRef] [Google Scholar]
- Becker, R. H., White, R. L., & Helfand, D. J. 1995, ApJ, 450, 559 [NASA ADS] [CrossRef] [Google Scholar]
- Celotti, A., Padovani, P., & Ghisellini, G. 1997, MNRAS, 286, 415 [NASA ADS] [CrossRef] [EDP Sciences] [Google Scholar]
- Chatterjee, R., Marscher, A. P., Jorstad, S. G., et al. 2009, ApJ, 704, 1689 [NASA ADS] [CrossRef] [Google Scholar]
- Chatterjee, R., Marscher, A. P., Jorstad, S. G., et al. 2011, ApJ, 734, 43 [Google Scholar]
- Cleary, K., Lawrence, C. R., Marshall, J. A., Hao, L., & Meier, D. 2007, ApJ, 660, 117 [NASA ADS] [CrossRef] [Google Scholar]
- Clements, S. D., & Carini, M. T. 2001, AJ, 121, 90 [NASA ADS] [CrossRef] [Google Scholar]
- D’Ammando, F., Raiteri, C. M., Villata, M., et al. 2011, A&A, 529, A145 [NASA ADS] [CrossRef] [EDP Sciences] [Google Scholar]
- Elvis, M., Hao, H., Civano, F., et al. 2012, ApJ, 759, 6 [NASA ADS] [CrossRef] [Google Scholar]
- Fan, J. H., Xie, G. Z., Pecontal, E., Pecontal, A., & Copin, Y. 1998, ApJ, 507, 173 [NASA ADS] [CrossRef] [Google Scholar]
- Francis, P. J., Hewett, P. C., Foltz, C. B., et al. 1991, ApJ, 373, 465 [NASA ADS] [CrossRef] [Google Scholar]
- Frank, J., King, A., & Raine, D. J. 2002, in Accretion Power in Astrophysics (Cambridge, UK: Cambridge University Press), 398 [Google Scholar]
- Ghisellini, G., Villata, M., Raiteri, C. M., et al. 1997, A&A, 327, 61 [NASA ADS] [Google Scholar]
- Ghosh, K. K., Ramsey, B. D., Sadun, A. C., & Soundararajaperumal, S. 2000, ApJS, 127, 11 [NASA ADS] [CrossRef] [Google Scholar]
- Grandi, P., & Palumbo, G. 2004, Science, 306, 998 [NASA ADS] [CrossRef] [Google Scholar]
- Gregory, P. C., Scott, W. K., Douglas, K., & Condon, J. J. 1996, ApJS, 103, 427 [NASA ADS] [CrossRef] [Google Scholar]
- Griffith, M. R., & Wright, A. E. 1993, AJ, 105, 1666 [NASA ADS] [CrossRef] [Google Scholar]
- Gu, M. F., & Ai, Y. L. 2011a, A&A, 528, A95 [NASA ADS] [CrossRef] [EDP Sciences] [Google Scholar]
- Gu, M. F., & Ai, Y. L. 2011b, A&A, 534, A59 [NASA ADS] [CrossRef] [EDP Sciences] [Google Scholar]
- Gu, M. F., Lee, C.-U., Pak, S., Yim, H. S., & Fletcher, A. B. 2006, A&A, 450, 39 [NASA ADS] [CrossRef] [EDP Sciences] [Google Scholar]
- Gu, M., Cao, X., & Jiang, D. R. 2009, MNRAS, 396, 984 [NASA ADS] [CrossRef] [Google Scholar]
- Gupta, A. C., & Joshi, U. C. 2005, A&A, 440, 855 [NASA ADS] [CrossRef] [EDP Sciences] [Google Scholar]
- Hu, S. M., Zhao, G., Guo, H. Y., Zhang, X., & Zheng, Y. G. 2006, MNRAS, 371, 1243 [NASA ADS] [CrossRef] [Google Scholar]
- Ivezić, Ž., Menou, K., Knapp, G. R., et al. 2002, AJ, 124, 2364 [NASA ADS] [CrossRef] [Google Scholar]
- Jorstad, S. G., Marscher, A. P., Stevens, J. A., et al. 2007, AJ, 134, 799 [NASA ADS] [CrossRef] [Google Scholar]
- Kellermann, K. I., Sramek, R., Schmidt, M., Shaffer, D. B., & Green, R. 1989, AJ, 98, 1195 [NASA ADS] [CrossRef] [Google Scholar]
- Kimball, A. E., & Ivezić, Ž. 2008, AJ, 136, 684 [NASA ADS] [CrossRef] [Google Scholar]
- Li, S. L., & Cao, X. W. 2008, MNRAS, 387, L41 [NASA ADS] [CrossRef] [Google Scholar]
- Liu, Y., Jiang, D. R., & Gu, M. F. 2006, ApJ, 637, 669 [NASA ADS] [CrossRef] [Google Scholar]
- Lu, Y., Wang, T., Zhou, H., & Wu, J. 2007, AJ, 133, 1615 [NASA ADS] [CrossRef] [Google Scholar]
- Lupton, R. H., Ivezić, Ž., Gunn, J. E., et al. 2002, Proc. SPIE, 4836, 350 [NASA ADS] [CrossRef] [Google Scholar]
- Massaro, E., Nesci, R., Maesano, M., Montagni, F., & D’Alessio, F. 1998, MNRAS, 299, 47 [NASA ADS] [CrossRef] [Google Scholar]
- Netzer, H. 1990 in Active Galactic Nuclei, eds. R. D. Blandford et al. (Berlin: Springer), 57 [Google Scholar]
- O’Dea, C. P. 1998, PASP, 110, 493 [NASA ADS] [CrossRef] [Google Scholar]
- Pereyra, N. A., Van den Berk, D. E., Turnshek, D. A., et al. 2006, ApJ, 642, 87 [NASA ADS] [CrossRef] [Google Scholar]
- Peterson, B. M. 1997, in An introduction to active galactic nuclei (Cambridge, New York: Cambridge University Press), 238 [Google Scholar]
- Pian, E., Urry, C. M., Maraschi, L., et al. 1999, ApJ, 521, 112 [NASA ADS] [CrossRef] [Google Scholar]
- Poon, H., Fan, J. H., & Fu, J. N. 2009, ApJS, 185, 511 [NASA ADS] [CrossRef] [Google Scholar]
- Raiteri, C. M., Villata, M., Aller, H. D., et al. 2001, A&A, 377, 396 [NASA ADS] [CrossRef] [EDP Sciences] [Google Scholar]
- Raiteri, C. M., Villata, M., Larionov, V. M., et al. 2007, A&A, 473, 819 [NASA ADS] [CrossRef] [EDP Sciences] [Google Scholar]
- Rani, B., Gupta, A. C., Strigachev, A., et al. 2010, MNRAS, 404, 1992 [NASA ADS] [Google Scholar]
- Sakata, Y., Morokuma, T., Minezaki, T., et al. 2011, ApJ, 731, 50 [NASA ADS] [CrossRef] [Google Scholar]
- Shakura, N. I., & Sunyaev, R. A. 1973, A&A, 24, 337 [NASA ADS] [Google Scholar]
- Schmidt, K. B., Rix, H.-W., Shields, J. C., et al. 2012, ApJ, 744, 147 [NASA ADS] [CrossRef] [Google Scholar]
- Schneider, D. P., Richards, G. T., Hall, P. B., et al. 2010, AJ, 139, 2360 [NASA ADS] [CrossRef] [Google Scholar]
- Siemiginowska, A., LaMassa, S., Aldcroft, T. L., Bechtold, J., & Elvis, M. 2008, ApJ, 684, 811 [NASA ADS] [CrossRef] [Google Scholar]
- Stalin, C. S., Gopal-Krishna, Sagar, R., & Wiita, P. J. 2004, MNRAS, 350, 175 [NASA ADS] [CrossRef] [Google Scholar]
- Stalin, C. S., Gupta, A. C., Gopal-Krishna, Wiita, P. J., & Sagar, R. 2005, MNRAS, 356, 607 [NASA ADS] [CrossRef] [Google Scholar]
- Vagnetti, F., Trevese, D., & Nesci, R. 2003, ApJ, 590, 123 [NASA ADS] [CrossRef] [Google Scholar]
- Van den Berk, D. E., Richards, G. T., Bauer, A., et al. 2001, AJ, 122, 549 [NASA ADS] [CrossRef] [Google Scholar]
- Van den Berk, D. E., Wilhite, B. C., Kron, R. G., et al. 2004, ApJ, 601, 692 [NASA ADS] [CrossRef] [Google Scholar]
- Vestergaard, M., & Peterson, B. M. 2006, ApJ, 641, 689 [NASA ADS] [CrossRef] [Google Scholar]
- Villata, M., Raiteri, C. M., Kurtanidze, O. M., et al. 2002, A&A, 390, 407 [NASA ADS] [CrossRef] [EDP Sciences] [Google Scholar]
- Wiita, P. J. 1996, in Blazar Continuum Variability, eds. H. R. Miller, J. R. Webb, & J. C. Noble, ASP Conf. Ser., 110, 42 [Google Scholar]
- Wilhite, B. C., Van den Berk, D. E., Kron, R. G., et al. 2005, ApJ, 633, 638 [NASA ADS] [CrossRef] [Google Scholar]
- Wilhite, B. C., Brunner, R. J., Grier, C. J., Schneider, D. P., & van den Berk, D. E. 2008, MNRAS, 383, 1232 [NASA ADS] [CrossRef] [Google Scholar]
- Wold, M., Brotherton, M. S., & Shang, Z. 2007, MNRAS, 375, 989 [NASA ADS] [CrossRef] [Google Scholar]
- Wu, J. H., Peng, B., Zhou, X., et al. 2005, AJ, 129, 1818 [NASA ADS] [CrossRef] [Google Scholar]
- Wu, J. H., Zhou, X., Ma, J., et al. 2007, AJ, 133, 1599 [NASA ADS] [CrossRef] [Google Scholar]
- Wu, J., Zhou, X., Ma, J., & Jiang, Z. 2011, MNRAS, 418, 1640 [NASA ADS] [CrossRef] [Google Scholar]
- Zuo, W., Wu, X.-B., Liu, Y.-Q., & Jiao, C.-L. 2012, ApJ, 758, 104 [NASA ADS] [CrossRef] [Google Scholar]
All Tables
All Figures
|
Fig. 1 Flux-flux diagram for our SSRQs represented by the rest frame flux density at frequencies corresponding to λu for y- and λi (see Table 1) for x-axis. The dotted line is the best fit standard accretion disk model with varied mass accretion rates and a constant black hole mass, and the dash-dotted line represents the best fit of a power law. The solid circles with error bars represent the multi-epoch flux data. The end of the figure is available online. |
| In the text | |
|
Fig. 2 Black hole mass estimated from the empirical relation of BLR radius and the BLR line width compared with the best-fit standard accretion disk model for 17 SSRQs after excluding the source with low accretion rate SDSS J013514.39−000703.8. The solid triangles are four sources with strong emission line contamination in either u or i bands. |
| In the text | |
|
Fig. 1 continued. |
| In the text | |
|
Fig. 1 continued. |
| In the text | |
Current usage metrics show cumulative count of Article Views (full-text article views including HTML views, PDF and ePub downloads, according to the available data) and Abstracts Views on Vision4Press platform.
Data correspond to usage on the plateform after 2015. The current usage metrics is available 48-96 hours after online publication and is updated daily on week days.
Initial download of the metrics may take a while.