Fig. 1
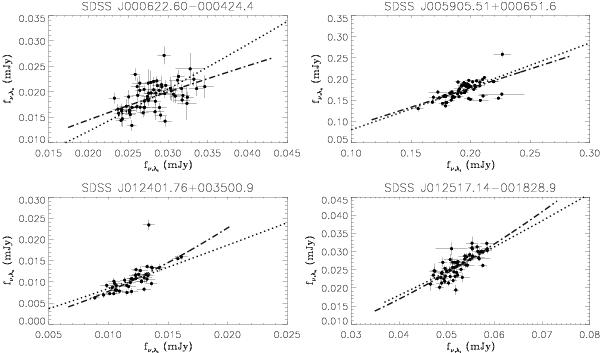
Flux-flux diagram for our SSRQs represented by the rest frame flux density at frequencies corresponding to λu for y- and λi (see Table 1) for x-axis. The dotted line is the best fit standard accretion disk model with varied mass accretion rates and a constant black hole mass, and the dash-dotted line represents the best fit of a power law. The solid circles with error bars represent the multi-epoch flux data. The end of the figure is available online.
Current usage metrics show cumulative count of Article Views (full-text article views including HTML views, PDF and ePub downloads, according to the available data) and Abstracts Views on Vision4Press platform.
Data correspond to usage on the plateform after 2015. The current usage metrics is available 48-96 hours after online publication and is updated daily on week days.
Initial download of the metrics may take a while.