Fig. 3
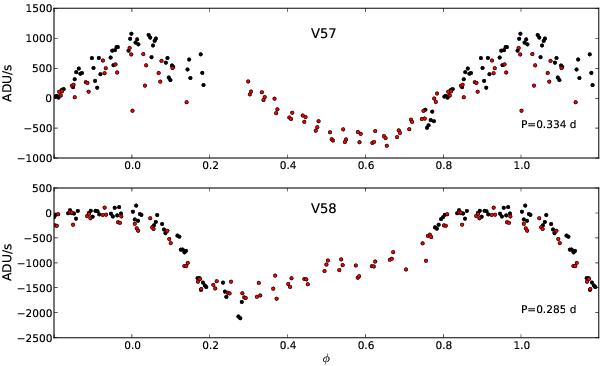
Phased light curves for the two new variable stars, plotted in differential flux units and using the periods from Table 1. Black and red dots represent the data from the first and second nights of observation, respectively. The typical uncertainty in the period is about 0.01 d for both variables.
Current usage metrics show cumulative count of Article Views (full-text article views including HTML views, PDF and ePub downloads, according to the available data) and Abstracts Views on Vision4Press platform.
Data correspond to usage on the plateform after 2015. The current usage metrics is available 48-96 hours after online publication and is updated daily on week days.
Initial download of the metrics may take a while.