Fig. 9
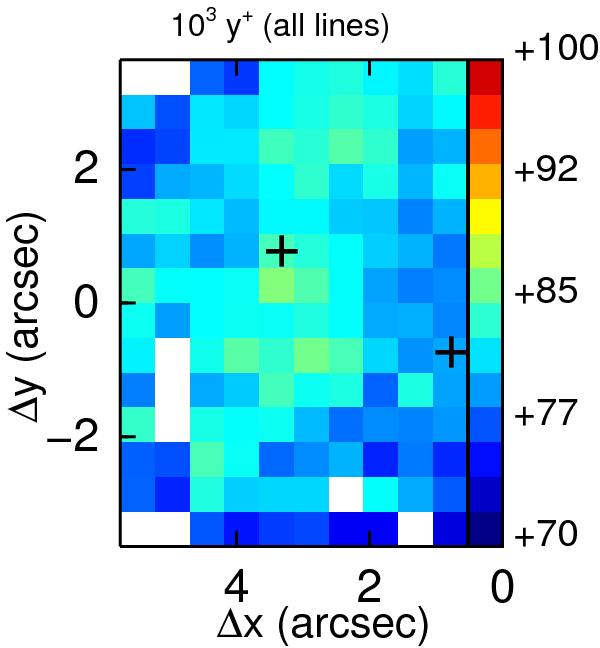
Final map for y+ derived from a weighted average of those derived for the lines in the blue and red sets. Note we used a different scale than in Fig. 7 to increase the contrast and emphasize the structure following the excitation structure. Instead, the scale is common with that in the right column of Fig. 12 to make easier the comparison between total and ionic helium abundances.
Current usage metrics show cumulative count of Article Views (full-text article views including HTML views, PDF and ePub downloads, according to the available data) and Abstracts Views on Vision4Press platform.
Data correspond to usage on the plateform after 2015. The current usage metrics is available 48-96 hours after online publication and is updated daily on week days.
Initial download of the metrics may take a while.