Free Access
Fig. 6
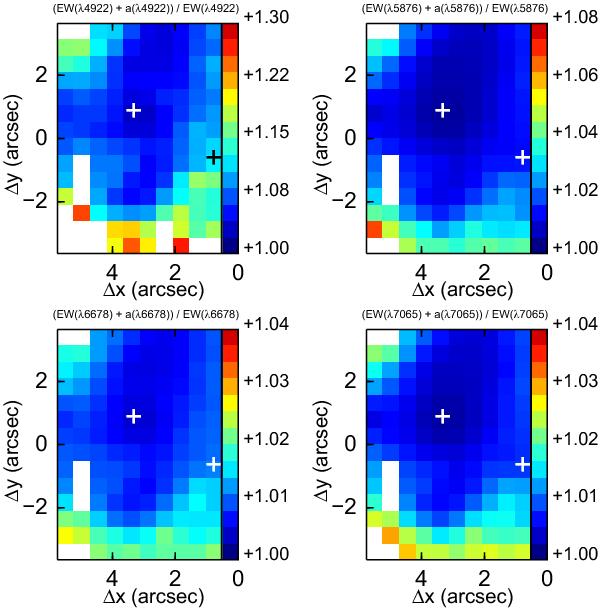
Maps of the correction factor due to a component in absorption in the He i lines. Different scales were utilized in the different maps to emphasize the structure. The corresponding map for the Hβ correction factor (not shown) is similar to those for λ6678 and λ7065.
Current usage metrics show cumulative count of Article Views (full-text article views including HTML views, PDF and ePub downloads, according to the available data) and Abstracts Views on Vision4Press platform.
Data correspond to usage on the plateform after 2015. The current usage metrics is available 48-96 hours after online publication and is updated daily on week days.
Initial download of the metrics may take a while.