Free Access
Fig. 4
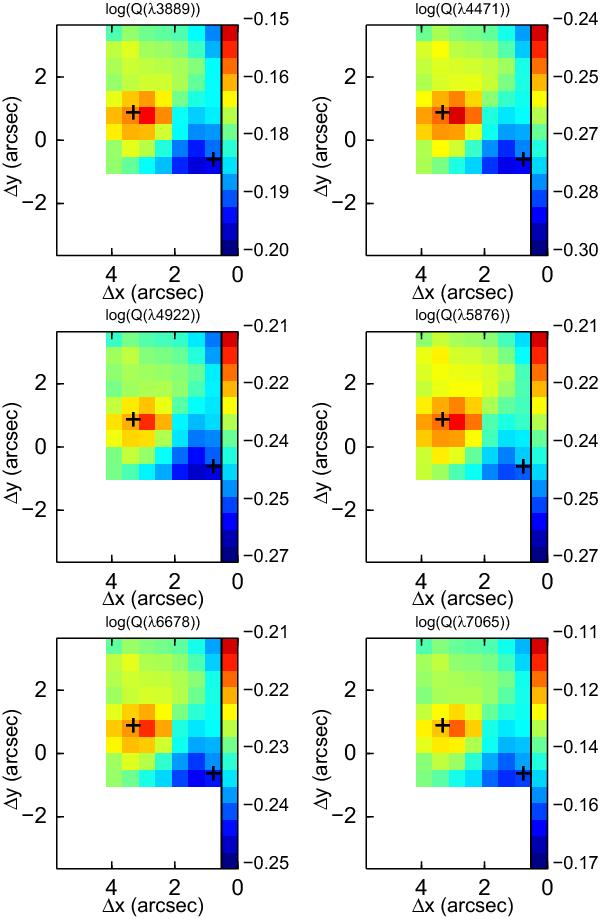
Maps for the ratio between the C/R factors derived for two assumptions of the Te(He i):  . Note that areas with constant values for which a Te([O iii]) = 10 500 K was assumed have not been included in the comparison. A logarithmic colour stretch is employed to emphasize the variations within the region for a given line.
Current usage metrics show cumulative count of Article Views (full-text article views including HTML views, PDF and ePub downloads, according to the available data) and Abstracts Views on Vision4Press platform.
Data correspond to usage on the plateform after 2015. The current usage metrics is available 48-96 hours after online publication and is updated daily on week days.
Initial download of the metrics may take a while.