Fig. 2
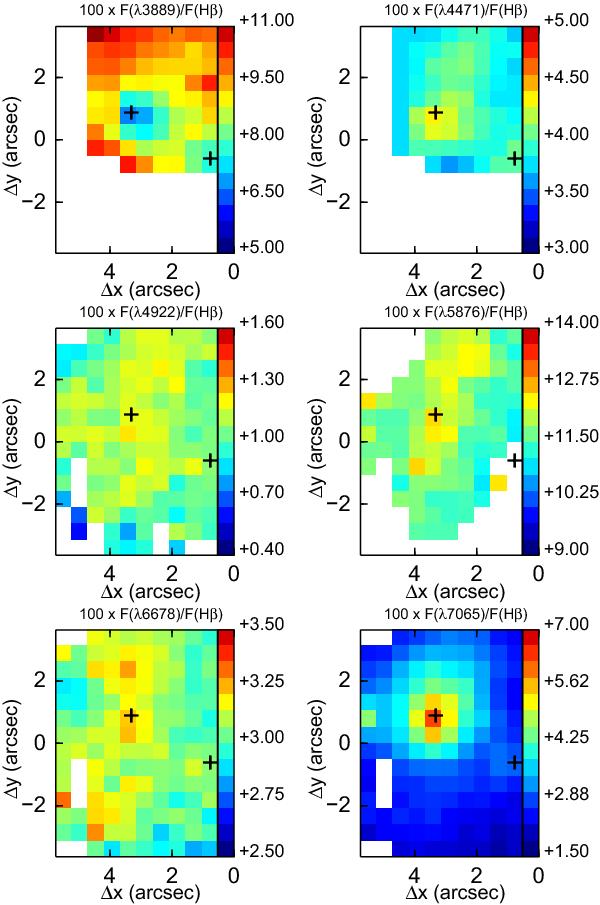
Extinction-corrected flux maps normalized to Hβ for the lines utilized in this work. The position of the two main peaks of continuum emission are marked with crosses in this and all subsequent maps. We marked in white the areas where a given line was not observed. Specifically, for the He iλ6678, He iλ4922 and He iλ7065, they correspond to dead fibres. For He iλ5876, He iλ4471 and He iλ3889, these areas were not covered by the corresponding GMOS or FLAMES-Argus field of view.
Current usage metrics show cumulative count of Article Views (full-text article views including HTML views, PDF and ePub downloads, according to the available data) and Abstracts Views on Vision4Press platform.
Data correspond to usage on the plateform after 2015. The current usage metrics is available 48-96 hours after online publication and is updated daily on week days.
Initial download of the metrics may take a while.