Fig. 10
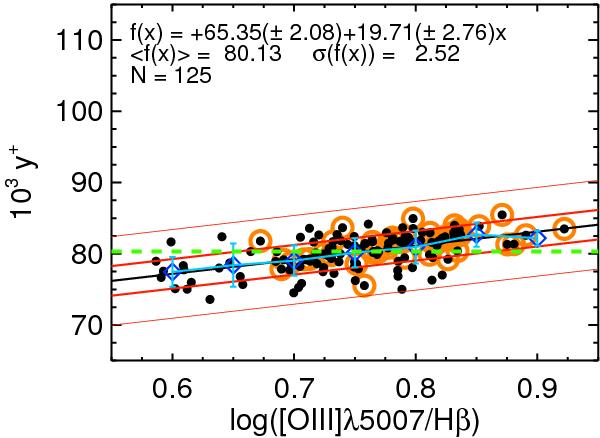
He+ abundance vs. [O iii]λ5007/Hβ. The first-degree polynomial fit is shown with a black line. The 1-σ and 3-σ levels are marked with thick and thin red lines respectively. Mean and standard deviation of each 0.05 dex bin in log ([O iii]λ5007/Hβ) are shown with blue diamonds and error bars respectively. The green horizontal dashed line shows the mean value. Data points corresponding to spaxels with log (N/O) > − 1.3 have been marked with orange circles.
Current usage metrics show cumulative count of Article Views (full-text article views including HTML views, PDF and ePub downloads, according to the available data) and Abstracts Views on Vision4Press platform.
Data correspond to usage on the plateform after 2015. The current usage metrics is available 48-96 hours after online publication and is updated daily on week days.
Initial download of the metrics may take a while.