Fig. 1
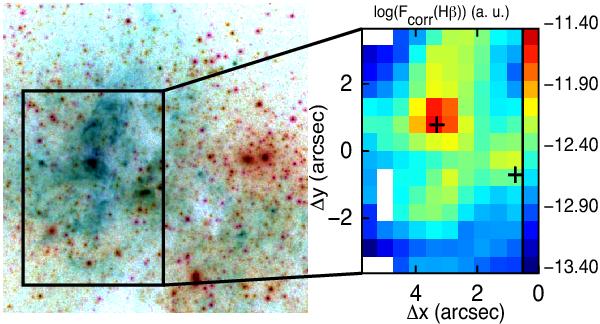
Left: false colour image in filters F658N (Hα, cyan channel), F550M (V, yellow channel), and F814W (I, magenta channel) for the central part of NGC 5253 using the HST-ACS images (programme 10608, P.I.: Vacca). The area studied here is marked with a black rectangle. Right: ionised gas distribution as traced by the extinction-corrected Hβ map derived from a portion of the original FLAMES data. The position of the two main peaks of continuum emission are marked with crosses. The map is presented in logarithmic scale in order to emphasize the relevant morphological features and cover a range of 2.0 dex. Flux units are arbitrary. Note the existence of three dead spaxels at  as well as absence of signal in the spaxels at the two left corners of the field of view.
Current usage metrics show cumulative count of Article Views (full-text article views including HTML views, PDF and ePub downloads, according to the available data) and Abstracts Views on Vision4Press platform.
Data correspond to usage on the plateform after 2015. The current usage metrics is available 48-96 hours after online publication and is updated daily on week days.
Initial download of the metrics may take a while.