Free Access
Fig. C.8
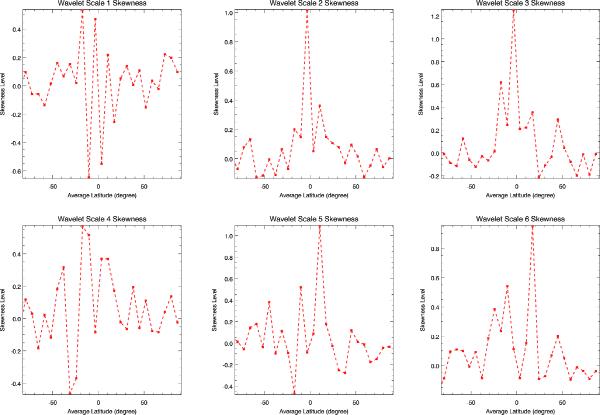
Centered and normalized skewness in the LGMCA map at 15 arcmin computed for various wavelet scales and locations. The same mask and set of simulations were employed to derive the statistic as in Fig. C.7.
Current usage metrics show cumulative count of Article Views (full-text article views including HTML views, PDF and ePub downloads, according to the available data) and Abstracts Views on Vision4Press platform.
Data correspond to usage on the plateform after 2015. The current usage metrics is available 48-96 hours after online publication and is updated daily on week days.
Initial download of the metrics may take a while.