Fig. 7
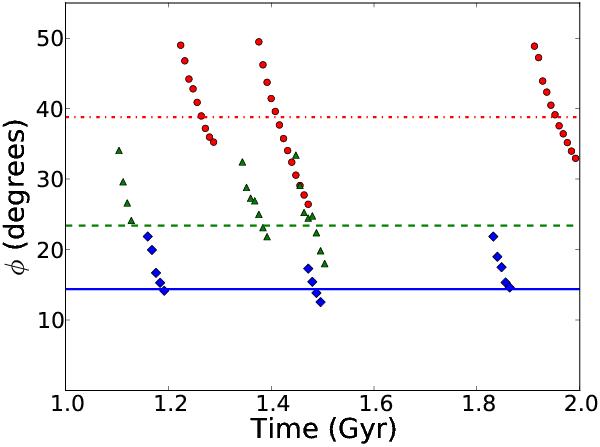
Pitch angle evolution of the overall spiral arm feature for simulations R (red circles), F (green triangles), and K (blue diamonds). In all cases the pitch angle decreases with time, which indicates the winding nature of the overall density peak. The horizontal lines represent the mean mode pattern pitch angle, determined from the patterns in Fig. 4 and shown in Table 2 for simulations R (dot-dashed red), F (dashed green), and K (solid blue). Note that the range of directly measured spiral arm pitch angles clearly map out separate domains about the mode pattern pitch angles of their respective galaxies.
Current usage metrics show cumulative count of Article Views (full-text article views including HTML views, PDF and ePub downloads, according to the available data) and Abstracts Views on Vision4Press platform.
Data correspond to usage on the plateform after 2015. The current usage metrics is available 48-96 hours after online publication and is updated daily on week days.
Initial download of the metrics may take a while.