Fig. 5
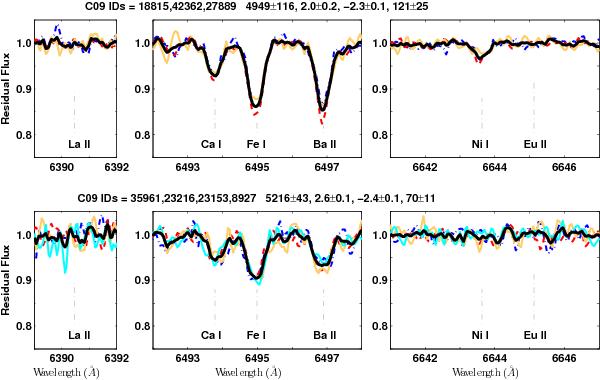
Component spectra (blue, red, orange) and resulting summed spectrum (black) for A in the top panels, and the four component spectra (blue, red, orange, cyan) and resulting summed spectrum (black) for B in the bottom panels, in the regions of the La II, Ba II and Eu II spectral lines respectively. The C09 IDs for each set of spectra and the resulting mean stellar parameters (Teff, log g, [Fe/H]) and S/N for the final summed spectrum for each of A and B are given.
Current usage metrics show cumulative count of Article Views (full-text article views including HTML views, PDF and ePub downloads, according to the available data) and Abstracts Views on Vision4Press platform.
Data correspond to usage on the plateform after 2015. The current usage metrics is available 48-96 hours after online publication and is updated daily on week days.
Initial download of the metrics may take a while.