Fig. 11
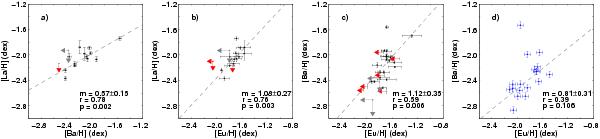
Comparisons of [La/H] with [Ba/H] and [La/H] with [Eu/H] for the 13 W13 stars with La, Eu and Ba measurements (a) and b)), and [Ba/H] with [Eu/H] for the 20 W13 stars with Ba and Eu measurements c). The errorbars for La and Ba are the fitting errors, while for Eu the errorbars are the standard deviation if two lines were measured, otherwise the errorbars are the fitting errors. The line of best fit (grey dash) and its slope (m), as well as the correlation coefficient (r) and p-value (p) of each dataset is given. Red arrows are upper limits on the abundances for particular stars. Grey arrows are limits determined for the two sets of summed spectra. d) [Ba/H] vs. [Eu/H] for the 18 S97W13 stars.
Current usage metrics show cumulative count of Article Views (full-text article views including HTML views, PDF and ePub downloads, according to the available data) and Abstracts Views on Vision4Press platform.
Data correspond to usage on the plateform after 2015. The current usage metrics is available 48-96 hours after online publication and is updated daily on week days.
Initial download of the metrics may take a while.