Fig. 1
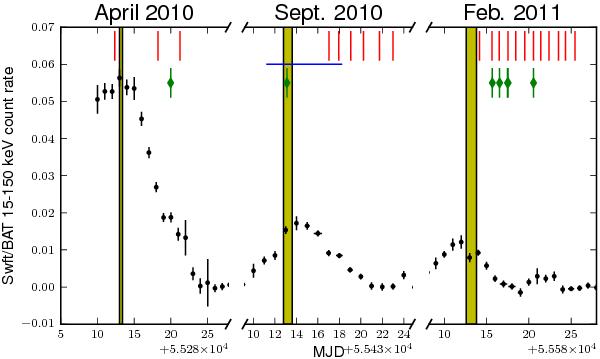
Light curve of RX J0440.9 + 4431 and times of the observations reported in this paper. Black points with errors: Swift/BAT daily averaged light curve. Red vertical bars: times of the RXTE observations. Blue horizontal bar: time span of the INTEGRAL data used in this paper. Green diamonds: times of the Swift observations used in our analysis. The first vertical yellow bar indicates the occurrence of the first maximum in the light curve; the others correspond to the times of the following maxima predicted by our orbital period determination. MJD 55 280, 55 430, and 55 580 correspond to 2010, March 25, 2010, August 22, and 2011, January 19, respectively.
Current usage metrics show cumulative count of Article Views (full-text article views including HTML views, PDF and ePub downloads, according to the available data) and Abstracts Views on Vision4Press platform.
Data correspond to usage on the plateform after 2015. The current usage metrics is available 48-96 hours after online publication and is updated daily on week days.
Initial download of the metrics may take a while.