Fig. 5
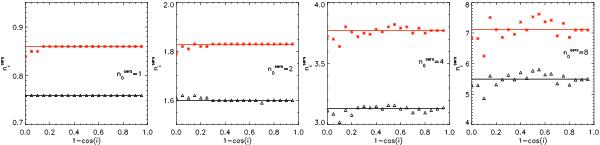
Derived Sérsic index  of the dust-free images of the bulge for bulges produced with volume stellar emissivities described by (deprojected) Sérsic functions with different Sérsic indices. The symbols represent the measurements while the solid line are polynomial fits to the measurements. From left to right, the plots correspond to the bulge Sérsic index values
  , and 8.0. The black curves correspond to bulges truncated at three effective radii while the red curves denote bulges truncated at ten effective radii.
Current usage metrics show cumulative count of Article Views (full-text article views including HTML views, PDF and ePub downloads, according to the available data) and Abstracts Views on Vision4Press platform.
Data correspond to usage on the plateform after 2015. The current usage metrics is available 48-96 hours after online publication and is updated daily on week days.
Initial download of the metrics may take a while.