Fig. 20
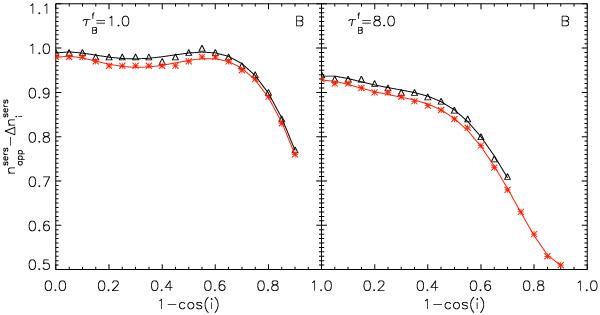
Inclination dependence of the derived Sérsic index of bulges due to dust effects only (corrected for projection effects), for bulges truncated at three effective radii (black curves) and at ten effective radii (red curves). The symbols represent the measurements while the solid lines are polynomial fits to the measurements. Results are for the B-band and for simulations corresponding to a volume stellar emissivity described by a (deprojected) Sérsic function with  . The left panel is for
  and the right panel is for
  .
.
Current usage metrics show cumulative count of Article Views (full-text article views including HTML views, PDF and ePub downloads, according to the available data) and Abstracts Views on Vision4Press platform.
Data correspond to usage on the plateform after 2015. The current usage metrics is available 48-96 hours after online publication and is updated daily on week days.
Initial download of the metrics may take a while.