Fig. 19
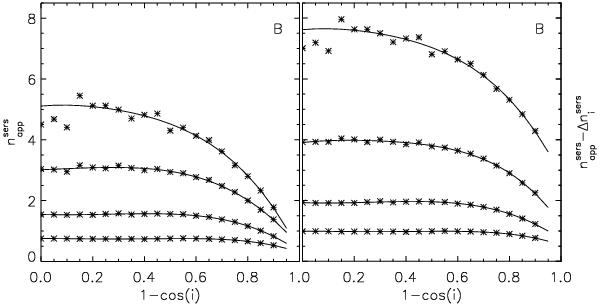
Left: inclination dependence of the derived Sérsic index of bulges due to combined dust and projection effects, in the B-band, for simulations having volume stellar emissivities described by different Sérsic indices,  (from bottom to top curve), and
  . The symbols represent the measurements while the solid lines are polynomial fits to the measurements. Right: the same, but corrected for projection effects (
 ).
).
Current usage metrics show cumulative count of Article Views (full-text article views including HTML views, PDF and ePub downloads, according to the available data) and Abstracts Views on Vision4Press platform.
Data correspond to usage on the plateform after 2015. The current usage metrics is available 48-96 hours after online publication and is updated daily on week days.
Initial download of the metrics may take a while.