Fig. 16
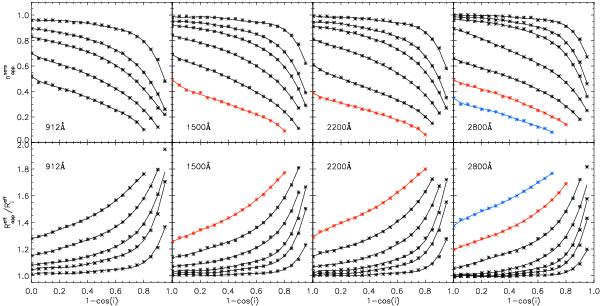
Upper row: inclination dependence of the derived Sérsic index for the dusty images of thin disks fitted with Sérsic functions. Lower row: same, for the ratio between the apparent and intrinsic Sérsic effective radii,  and
and  respectively. The symbols represent the measurements while the solid lines are polynomial fits to the measurements. From left to right, the plots corresponds to increasing UV wavelengths: 912 Å, 1500 Å, 2200 Å, and 2800 Å. The black curves are plotted for
  (from top to bottom, in this order for the upper row and in reverse order for the lower row). The red curve corresponds to
  , while the blue one is for
  .
.
Current usage metrics show cumulative count of Article Views (full-text article views including HTML views, PDF and ePub downloads, according to the available data) and Abstracts Views on Vision4Press platform.
Data correspond to usage on the plateform after 2015. The current usage metrics is available 48-96 hours after online publication and is updated daily on week days.
Initial download of the metrics may take a while.