Free Access
Fig. 15
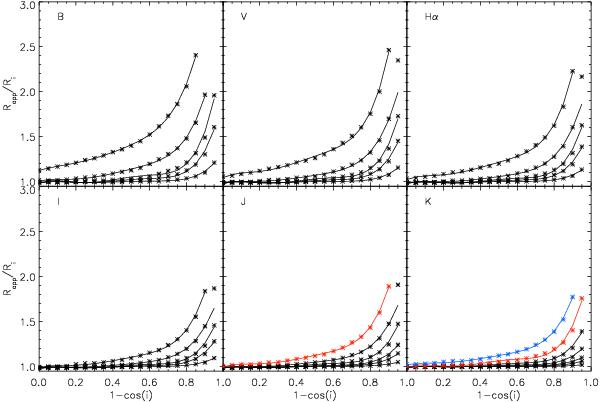
Same as in Fig. 14, for the optical bands and the Hα line. From bottom to top the black curves are plotted for 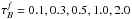 . The red curve corresponds to
  , while the blue one is for
  .
.
Current usage metrics show cumulative count of Article Views (full-text article views including HTML views, PDF and ePub downloads, according to the available data) and Abstracts Views on Vision4Press platform.
Data correspond to usage on the plateform after 2015. The current usage metrics is available 48-96 hours after online publication and is updated daily on week days.
Initial download of the metrics may take a while.