Fig. 13
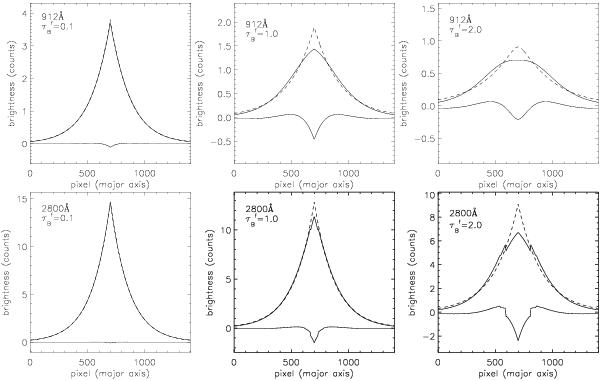
Face-on major-axis profiles for the thin disk showing the deviations from pure exponentials due to dust effects. Solid upper curves are for the face-on dusty images, the corresponding exponential fits are represented by dashed curves, while the solid lower curves denote the residuals. The upper plots correspond to the 912 Å UV wavelength and  (from left to right), while the lower plots correspond to the 2800 Å UV wavelength and the same values of
  . The fits were done by leaving the geometrical coordinates of the intensity peak as free parameters. The cuts were taken parallel and perpendicular with the major-axis of the thin disk dusty images, through their intensity peaks.
Current usage metrics show cumulative count of Article Views (full-text article views including HTML views, PDF and ePub downloads, according to the available data) and Abstracts Views on Vision4Press platform.
Data correspond to usage on the plateform after 2015. The current usage metrics is available 48-96 hours after online publication and is updated daily on week days.
Initial download of the metrics may take a while.