Fig. 1
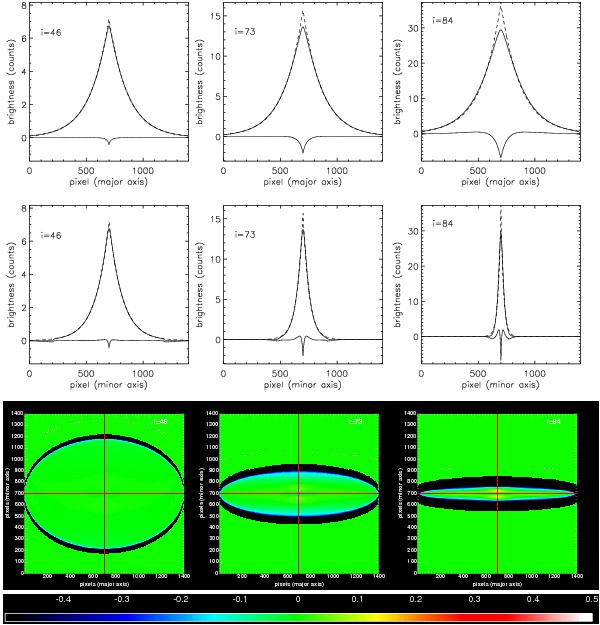
Major- and minor-axis disk profiles (upper and middle rows) showing the deviations from pure exponentials due to projection effects. Solid upper curves are for B-band dust-free images, dashed curves are for corresponding exponential fits, while absolute residuals (simulation-fit) are represented by solid lower curves. The fits were made by fixing the position of the intensity peak of the fitted image to the geometrical centre of the map, which, in this case, corresponds to the intensity peak in the simulated image. The cuts were taken parallel and perpendicular to the major-axis of the disk images, through their geometrical centres, at inclinations 1 − cos(i) = 0.3,0.7,0.9 (i = 46°,73°,84°). Lower row: corresponding relative residuals  , at the same inclinations as the profiles. The red lines show radial and vertical cuts through the geometrical centre of each image.
Current usage metrics show cumulative count of Article Views (full-text article views including HTML views, PDF and ePub downloads, according to the available data) and Abstracts Views on Vision4Press platform.
Data correspond to usage on the plateform after 2015. The current usage metrics is available 48-96 hours after online publication and is updated daily on week days.
Initial download of the metrics may take a while.