Fig. 8
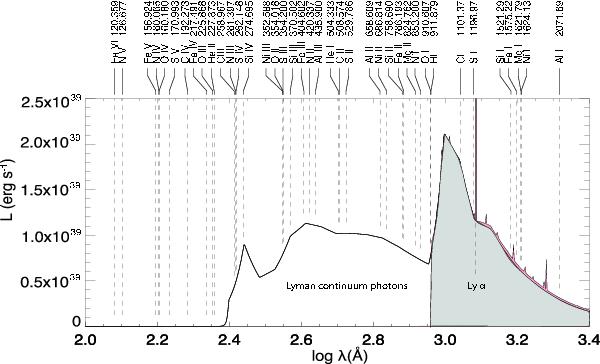
Cloudy model spectral energy distribution of I Zw 18. The flux distribution of the stellar population incident on the inner edge of the H ii region is shown in white, the stellar flux transmitted to the H i region in gray. The wavelength of the ionization edge of relevant species is given along the top of the figure. The H ii region absorbs virtually all the H i Lyman continuum and converts it to H i Lyα, nebular continuum, and line emission (all shown in red).
Current usage metrics show cumulative count of Article Views (full-text article views including HTML views, PDF and ePub downloads, according to the available data) and Abstracts Views on Vision4Press platform.
Data correspond to usage on the plateform after 2015. The current usage metrics is available 48-96 hours after online publication and is updated daily on week days.
Initial download of the metrics may take a while.