Fig. 7
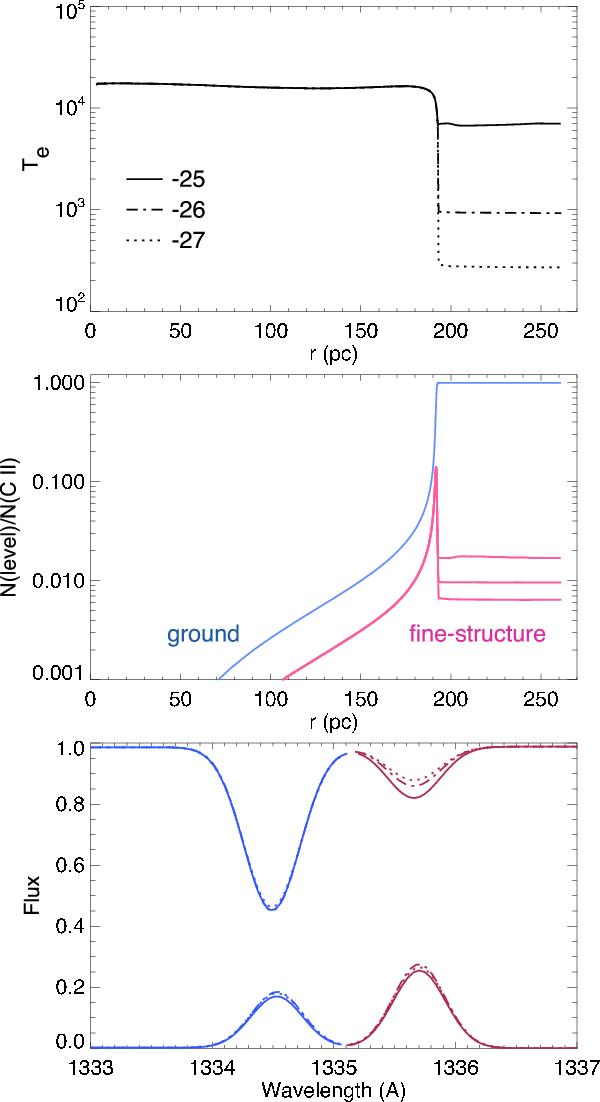
Effect of extra heating in the H i region. The electron temperature (top panel) and the fraction of C ii and C ii* to total carbon (middle panel) are shown as a function of radius to the ionizing stars. The predicted line strength is shown in the bottom panel. The models assume unity for both the covering fraction of the H ii region and the fraction of the emission subtended by the COS aperture (see Sect. 4.2).
Current usage metrics show cumulative count of Article Views (full-text article views including HTML views, PDF and ePub downloads, according to the available data) and Abstracts Views on Vision4Press platform.
Data correspond to usage on the plateform after 2015. The current usage metrics is available 48-96 hours after online publication and is updated daily on week days.
Initial download of the metrics may take a while.