Fig. 5
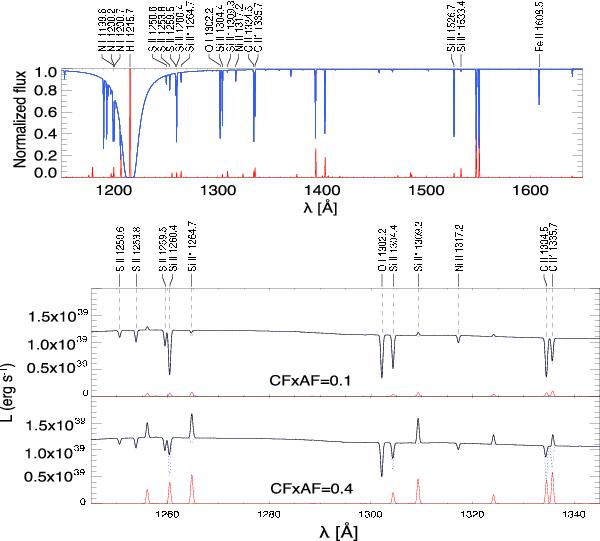
Cloudspec model spectra. Top: stellar and nebular (H i and H ii region) component normalized to the stellar continuum (blue) and emission component (red). Both component spectra have been convolved with a Gaussian line-spread function having a FWHM = 0.5 Å to simulate the observations. Major absorption lines formed in the H i region are labeled on top. Most other strong lines, e.g. the Si ivλ1400 doublet, C ivλ1549 doublet, are higher ionization lines formed in the H ii region. The absorption component of Lyα completely erases the Lyα emission formed in the H ii region. Bottom: simple model spectrum for the case CF × AF = 0.1 (top) and for CF × AF = 0.4 (bottom), with CF the covering fraction and AF the aperture fraction (see text). The dotted line is the absorption spectrum, and the bold line is the net spectrum. The component and net spectra have been convolved with a Gaussian line-spread function having a FWHM = 0.5 Å.
Current usage metrics show cumulative count of Article Views (full-text article views including HTML views, PDF and ePub downloads, according to the available data) and Abstracts Views on Vision4Press platform.
Data correspond to usage on the plateform after 2015. The current usage metrics is available 48-96 hours after online publication and is updated daily on week days.
Initial download of the metrics may take a while.