Fig. 13
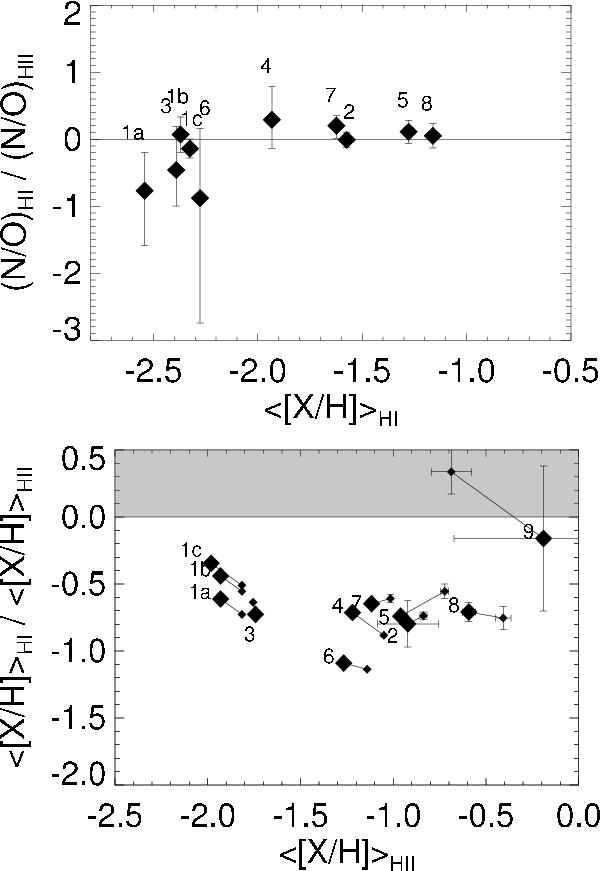
Top: comparison of the N/O ratio between the H i and H ii region for the sample of BCDs studied with FUSE, and for I Zw 18 with COS. The labels are defined as 1a) I Zw 18 (L04), 1b) I Zw 18 (A03), 1c) I Zw 18 (this study, with S as a tracer of O; Sect. 6.2), 2) NGC 1705 (Heckman et al. 2001), 3) SBS 0335-052 (Thuan et al. 2005), 4) Mark 59 (Thuan et al. 2002), 5) NGC 625 (Cannon et al. 2005), 6) I Zw 36 (Lebouteiller et al. 2004), 7) Pox 36 (Lebouteiller et al. 2009), 8) NGC 604 (Lebouteiller et al. 2006), 9) SBS 1543+593 (Bowen et al. 2005; Schulte Ladbeck et al. 2004). Bottom: ratio of the average metal abundance [M / H] = ⟨ [X / H] ⟩ between the H i and H ii regions. [M/H] is calculated two ways, averaging all elements observed in each phase (small diamonds), and averaging only the elements observed in both phases (large diamonds).
Current usage metrics show cumulative count of Article Views (full-text article views including HTML views, PDF and ePub downloads, according to the available data) and Abstracts Views on Vision4Press platform.
Data correspond to usage on the plateform after 2015. The current usage metrics is available 48-96 hours after online publication and is updated daily on week days.
Initial download of the metrics may take a while.