Fig. 11
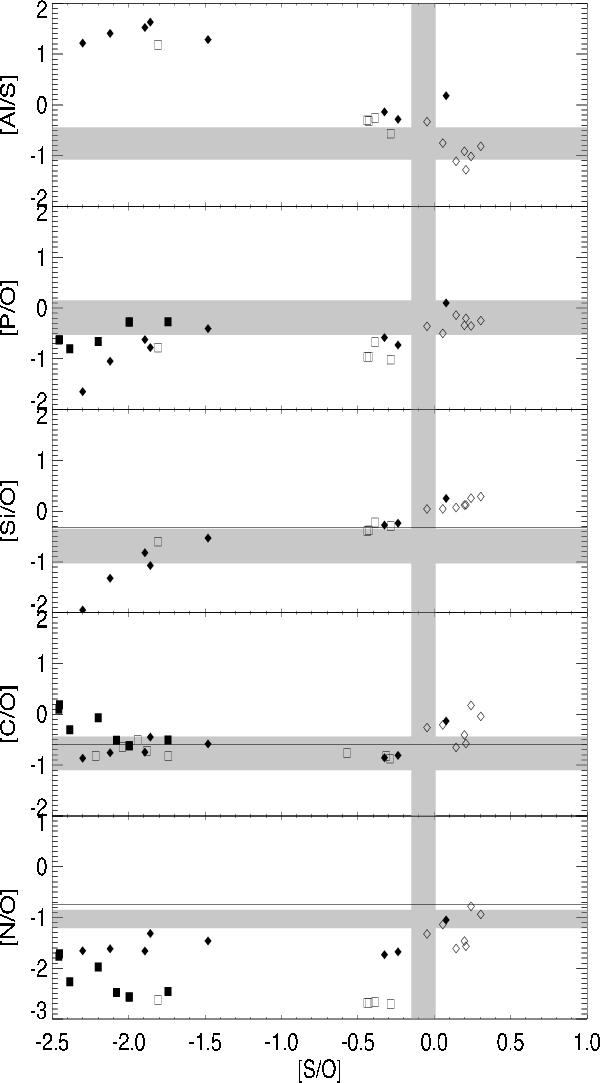
Abundance ratios calculated from the stellar yields of Woosley & Weaver (1995). Yields are plotted for two mass ranges, 11–25 M⊙ (open symbols) and 30–40 M⊙ (filled symbols), and two metallicities, 0.1 Z⊙ (diamonds) and 0.01 Z⊙ (squares). The grey stripe shows the observed values. The horizontal black line shows the average ratio observed in the H ii region of BCDs (Izotov et al. 1999).
Current usage metrics show cumulative count of Article Views (full-text article views including HTML views, PDF and ePub downloads, according to the available data) and Abstracts Views on Vision4Press platform.
Data correspond to usage on the plateform after 2015. The current usage metrics is available 48-96 hours after online publication and is updated daily on week days.
Initial download of the metrics may take a while.