Fig. 4
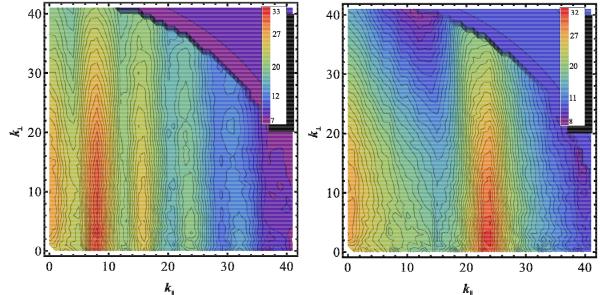
Two-dimensional magnetic energy spectra of both peaks in the simulation with  G. These are the base scenarios for the particle simulations during the decay stage of the peaks. Therefore the left figure shows the state for the
  peak at t = 17 s. The right figure shows
  at t = 5.1 s. The colours indicate the logarithm of the total spectral energy.
Current usage metrics show cumulative count of Article Views (full-text article views including HTML views, PDF and ePub downloads, according to the available data) and Abstracts Views on Vision4Press platform.
Data correspond to usage on the plateform after 2015. The current usage metrics is available 48-96 hours after online publication and is updated daily on week days.
Initial download of the metrics may take a while.