Fig. 12
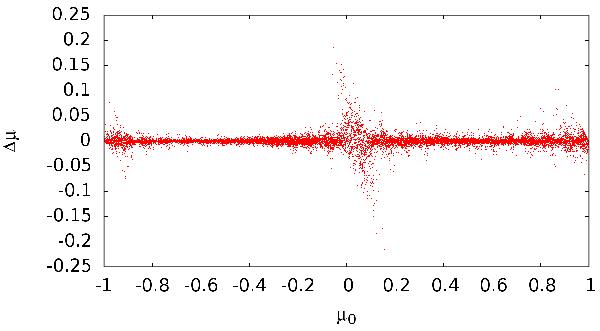
Scatter plots for the high  gridsize, peak position
  , decay stage, t = 50 gyration periods. As in the toy model, the reduced δB/B0 ratio leads to decreased effective tilts of the resonances. After a long simulation time of 50 gyrations, the resonant interactions become very narrow. The small increase of the scattering near μ0 = 0.5 might be caused by the
  higher harmonic.
Current usage metrics show cumulative count of Article Views (full-text article views including HTML views, PDF and ePub downloads, according to the available data) and Abstracts Views on Vision4Press platform.
Data correspond to usage on the plateform after 2015. The current usage metrics is available 48-96 hours after online publication and is updated daily on week days.
Initial download of the metrics may take a while.