Fig. 4
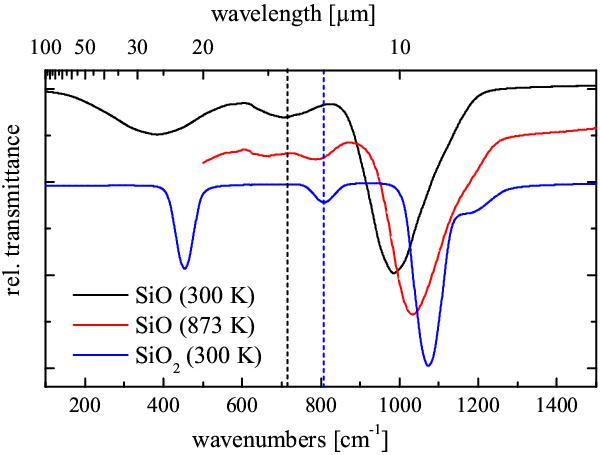
Simulated spectra at 300 K for SiO (oscillator data from Table 1) and SiO2 (oscillator data from Wetzel 2012) compared to the measurement of a SiO film that was annealed at 873 K. The spectra are shifted against each other, and the dashed lines indicate the oscillator position of the Si stretching mode of SiO and SiO2, respectively.
Current usage metrics show cumulative count of Article Views (full-text article views including HTML views, PDF and ePub downloads, according to the available data) and Abstracts Views on Vision4Press platform.
Data correspond to usage on the plateform after 2015. The current usage metrics is available 48-96 hours after online publication and is updated daily on week days.
Initial download of the metrics may take a while.