Fig. 5
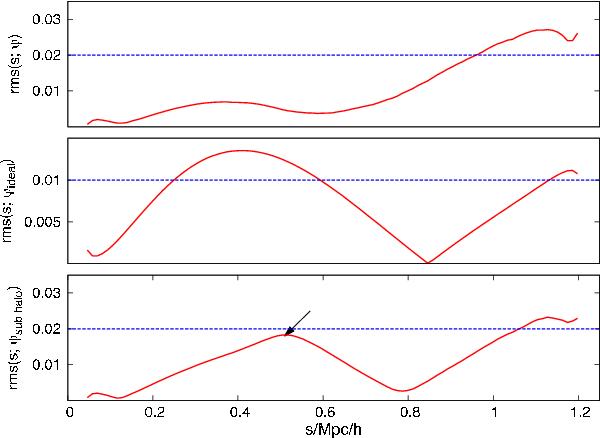
From top to bottom: rms deviation of ψ from ψtrue, rms deviation of ψideal from ψtrue and rms deviation of ψsubhalo from ψtrue, according to Eq. (39). Calculated from 200 realisations of a modelled galaxy cluster with a mass of 5 × 10¹⁴h-1 M⊙, a subhalo with mass 1 × 10¹⁴h-1 M⊙, and a redshift of 0.2. The blue lines represent a 2.0% and 1.0% threshold.
Current usage metrics show cumulative count of Article Views (full-text article views including HTML views, PDF and ePub downloads, according to the available data) and Abstracts Views on Vision4Press platform.
Data correspond to usage on the plateform after 2015. The current usage metrics is available 48-96 hours after online publication and is updated daily on week days.
Initial download of the metrics may take a while.