Fig. 9
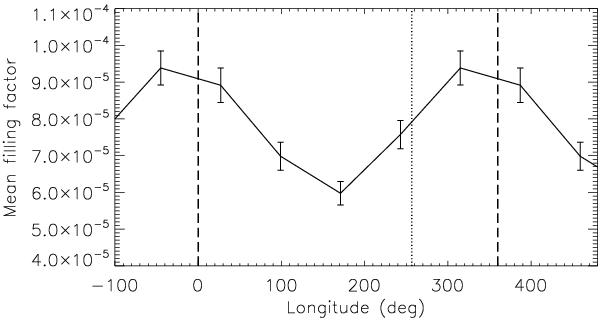
Spotted area in 72° longitude bins averaged versus time as derived from the ME regularized models with Q = 8.0. The error bars indicate the standard error of the spotted area in the corresponding bin. The dotted line marks the subcompanion point longitude, while the dashed lines indicate the longitudes 0° and 360° beyond which the distribution is repeated for clarity.
Current usage metrics show cumulative count of Article Views (full-text article views including HTML views, PDF and ePub downloads, according to the available data) and Abstracts Views on Vision4Press platform.
Data correspond to usage on the plateform after 2015. The current usage metrics is available 48-96 hours after online publication and is updated daily on week days.
Initial download of the metrics may take a while.