Fig. 8
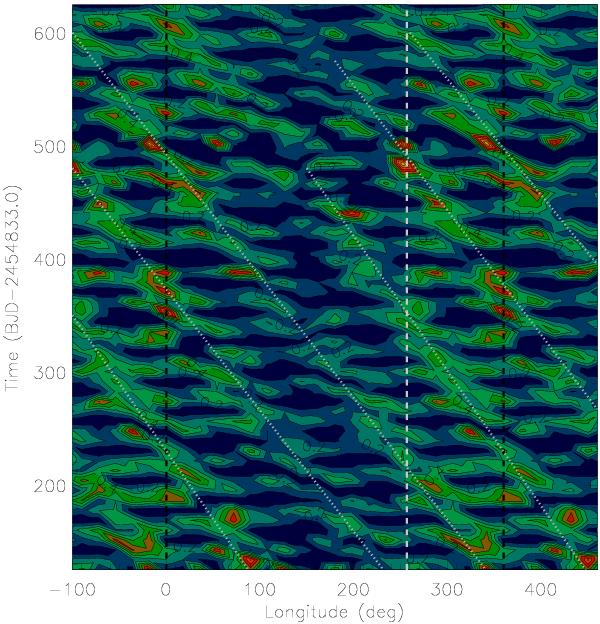
Isocontours of the ratio f/fmax, where f is the spot covering factor and fmax = 0.00059 its maximum value, versus time and longitude for the ME models with Q = 8.0. The two dashed black lines mark longitudes 0° and 360° beyond which the distributions are repeated to easily follow spot migration. The dashed white line marks the longitude of the subcompanion point, which is fixed in this reference frame at ~257°. The contour levels are separated by Δf = 0.1fmax with yellow and orange indicating the maximum covering factor and dark blue the minimum. The dotted white lines trace the migration of the active regions associated with each active longitude (see the text).
Current usage metrics show cumulative count of Article Views (full-text article views including HTML views, PDF and ePub downloads, according to the available data) and Abstracts Views on Vision4Press platform.
Data correspond to usage on the plateform after 2015. The current usage metrics is available 48-96 hours after online publication and is updated daily on week days.
Initial download of the metrics may take a while.