Fig. 6
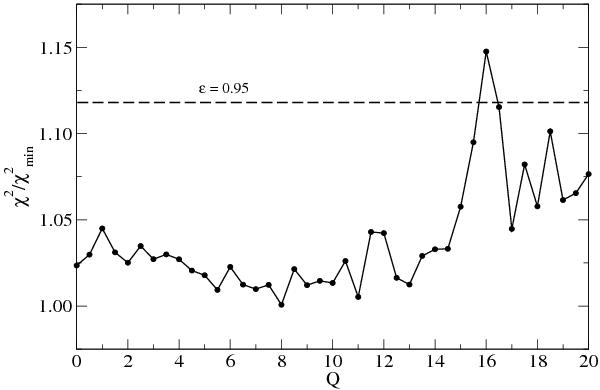
Ratio of the χ2 of the composite best fit of the entire time series to its minimum value vs. the parameter Q, i.e., the ratio of the facular area to the cool spot area in active regions. The horizontal dashed line indicates the 95% confidence level for χ2/ . This does not put any significant constraint on the interval of acceptable Q values owing to the low signal-to-noise ratio of the data.
Current usage metrics show cumulative count of Article Views (full-text article views including HTML views, PDF and ePub downloads, according to the available data) and Abstracts Views on Vision4Press platform.
Data correspond to usage on the plateform after 2015. The current usage metrics is available 48-96 hours after online publication and is updated daily on week days.
Initial download of the metrics may take a while.