Fig. 4
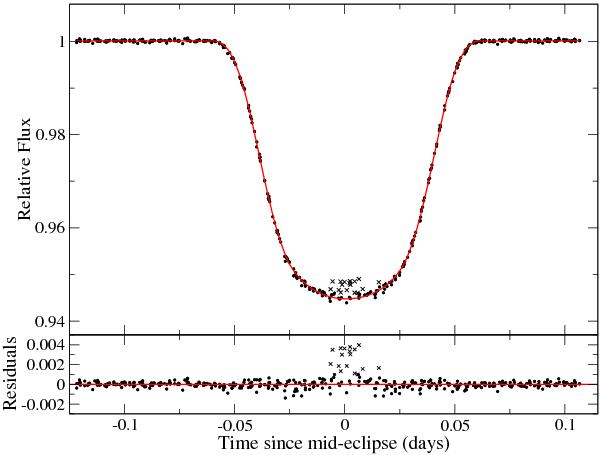
Upper panel: Kepler LHS 6343 transit photometry from Q0–Q6 (black dots) and the best fit model obtained as described in Sect. 3.1 (red line); crosses indicate data corresponding to spot occultations during the transits. They are not used for modelling the transit. Lower panel: the residuals of the transit best fit (black dots) and the points corresponding to spot occultations (crosses) vs. the time elapsed from mid-transit.
Current usage metrics show cumulative count of Article Views (full-text article views including HTML views, PDF and ePub downloads, according to the available data) and Abstracts Views on Vision4Press platform.
Data correspond to usage on the plateform after 2015. The current usage metrics is available 48-96 hours after online publication and is updated daily on week days.
Initial download of the metrics may take a while.