Fig. 3
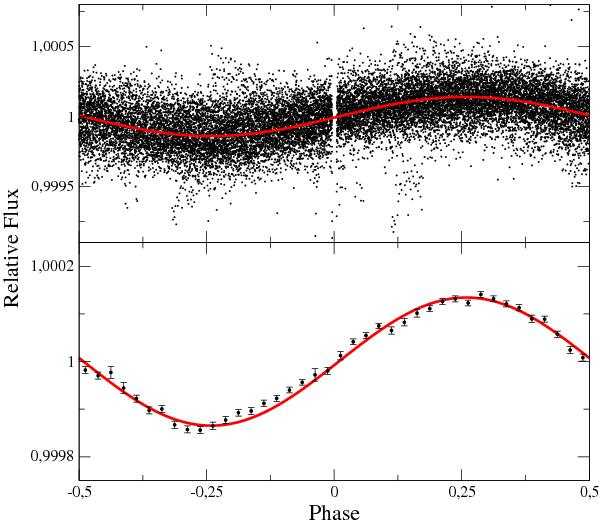
Upper panel: Kepler light curve of LHS 6343 phased with a period of 12.71 days (black dots). The transits have been removed leaving a gap centred on phase 0. The sinusoidal best fit applied to calculate the phase lead (~98°) is plotted as a red solid line. Lower panel: the vertical scale is zoomed in and the Kepler data are plotted in 0.025 phase bins to highlight the deviations from a sinusoidal shape which cause the appearance of harmonics of the main frequency in the periodogram of Fig. 2. Error bars are 1-σ deviations of the binned flux values.
Current usage metrics show cumulative count of Article Views (full-text article views including HTML views, PDF and ePub downloads, according to the available data) and Abstracts Views on Vision4Press platform.
Data correspond to usage on the plateform after 2015. The current usage metrics is available 48-96 hours after online publication and is updated daily on week days.
Initial download of the metrics may take a while.