Fig. 1
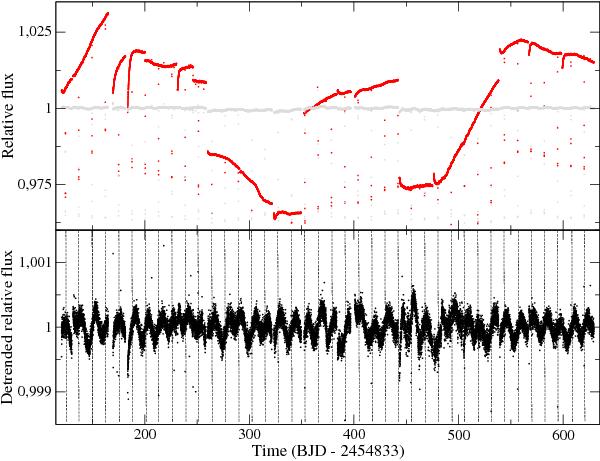
Upper panel: Kepler SAP light curve of LHS 6343, covering the first six quarters (red dots), and after correction from main trends using cotrending basis vectors (grey dots). Lower panel: LHS 6343 light curve after low-order polynomial filtering, as adopted for subsequent analysis. The times of mid-transits of LHS 6343 C are marked by vertical dashed lines.
Current usage metrics show cumulative count of Article Views (full-text article views including HTML views, PDF and ePub downloads, according to the available data) and Abstracts Views on Vision4Press platform.
Data correspond to usage on the plateform after 2015. The current usage metrics is available 48-96 hours after online publication and is updated daily on week days.
Initial download of the metrics may take a while.