Fig. 8
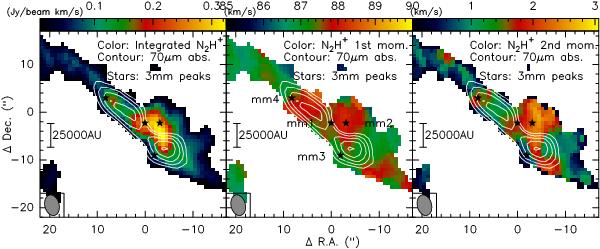
N2H+(1 − 0) moment maps of the PdBI-only data toward IRDC 18310-4. The left, middle and right panel show in color the 0th moment (integrated intensity), 1st moment (intensity-weighted peak velocity) and 2nd moment (intensity-weighted linewidth), respectively. The moments were again extracted for the isolated hyperfine component − 8.0 km s-1 from the line center. The 1st moment was calculated from this isolated hyperfine component and then shifted toward by + 8.0 km s-1 to the vlsr of the source again. The white contours outline the 70 μm extinction feature and the stars mark the 3.2 mm peak positions from Fig. 2. The synthesized beam and a scale-bar are shown again.
Current usage metrics show cumulative count of Article Views (full-text article views including HTML views, PDF and ePub downloads, according to the available data) and Abstracts Views on Vision4Press platform.
Data correspond to usage on the plateform after 2015. The current usage metrics is available 48-96 hours after online publication and is updated daily on week days.
Initial download of the metrics may take a while.