Fig. 7
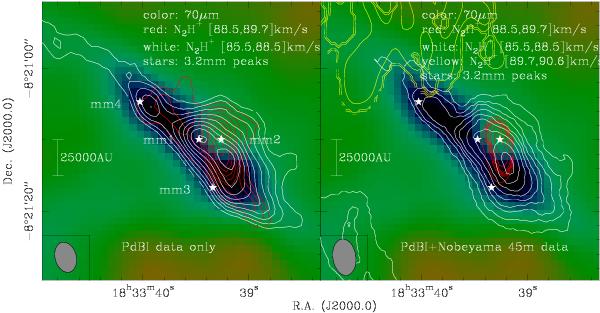
PdbI only (left panel) and merged PdBI+Nobeyama 45 m N2H+(1 − 0) data (right panel). The color-scale shows the 70 μm extinction feature, and the contours present the integrated N2H+(1 − 0) emission of three different velocity components as indicated in the figure. To avoid hyperfine-splitting overlap, these integrated maps were created from the isolated hyperfine component − 8.0 km s-1 apart from the central component, and then the velocity shifted to the center to be comparable with other line measurements. The contouring is done from 15 to 95% of the peak emission of each dataset, respectively. The mm-labels, a synthesized beam and a scale-bar are shown as well.
Current usage metrics show cumulative count of Article Views (full-text article views including HTML views, PDF and ePub downloads, according to the available data) and Abstracts Views on Vision4Press platform.
Data correspond to usage on the plateform after 2015. The current usage metrics is available 48-96 hours after online publication and is updated daily on week days.
Initial download of the metrics may take a while.