Free Access
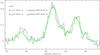
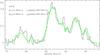
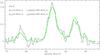
Fig. 6
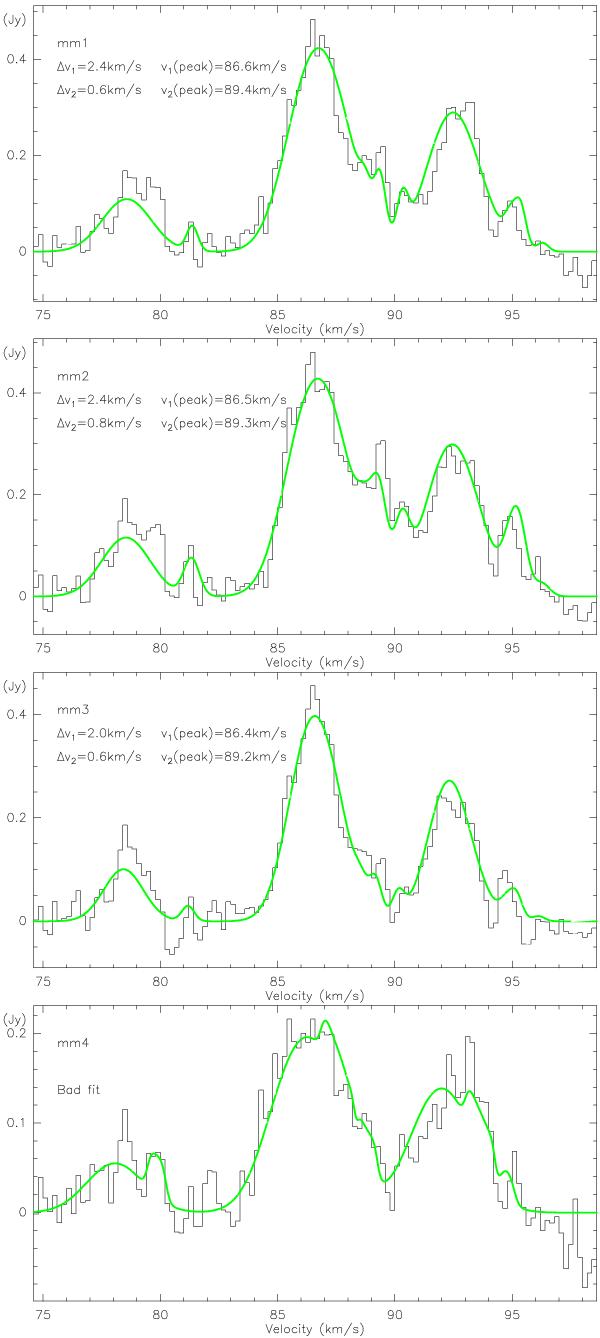
Spectra and N2H+(1 − 0) hyperfine spectral line fits extracted from the PdBI+Nobeyama N2H+(1 − 0) data toward the mm-peak positions marked in Fig. 2. Fit results and source labels are presented in each panel.
This figure is made of several images, please see below:
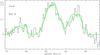
Current usage metrics show cumulative count of Article Views (full-text article views including HTML views, PDF and ePub downloads, according to the available data) and Abstracts Views on Vision4Press platform.
Data correspond to usage on the plateform after 2015. The current usage metrics is available 48-96 hours after online publication and is updated daily on week days.
Initial download of the metrics may take a while.